Wheat Elliott Wave Analysis 

Wheat Elliott Wave Technical Analysis 

Function - Trend

Mode - Trend

Structure - Impulse for wave (A)

Position - Wave 5 of  (A)

Direction - Wave (B)

Details -  Wave 5 of (A) could be completed with an ending diagonal. Pullback for (B) should begin afterwards.

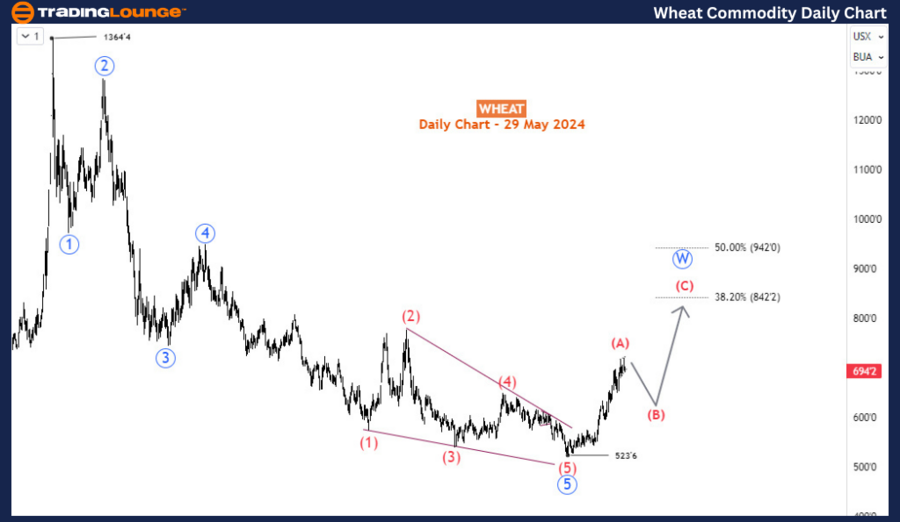
Since March 2024, wheat prices have shown a notable recovery, moving higher progressively. However, a potential slowdown and downward correction could occur soon. Despite this short-term correction, the overall recovery trend is expected to persist. The initial recovery from the March low of 523 is anticipated to reach the 840-940 range in the medium term. Yet, the long-term bearish trend might resume in the year's last quarter.

Daily Chart Analysis

The daily chart shows a bearish impulse wave starting at 1364 in March 2022, concluding at 523 in March 2024, marking a two-year sell-off. The subsequent recovery from 523 is approaching the completion of an impulse wave. This implies we should expect at least an (A)-(B)-(C) bullish correction continuing towards higher price levels, likely in the 842-942 range, corresponding to the 38.2-50% Fibonacci retracement zone. Prices might even move higher. This bullish corrective cycle is projected to extend until the year's last quarter. Currently, focus on the completion of wave (A) and anticipate a retracement in wave (B).
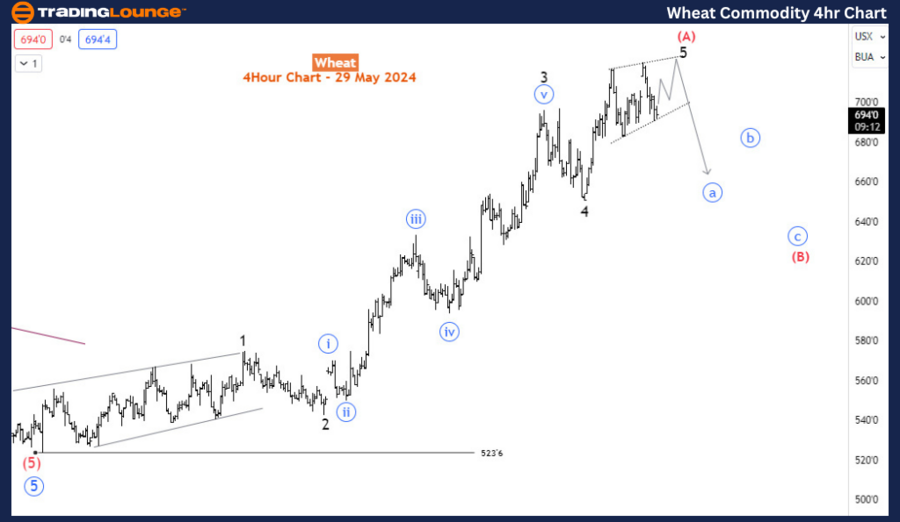
Wheat-Day-Commodity-...


H4 Chart Analysis

The H4 chart reveals wave (A) nearing completion, forming an ending diagonal for wave 5. A bearish retracement for wave (B) is expected to start soon. The prudent strategy is to wait for wave (B) to complete before considering long positions in wave (C), provided wave (B) does not breach the 523 low.

Technical Analyst: Sanmi Adeagbo

Source: visit Tradinglounge.com and learn From the Experts Join TradingLounge Here 

See Previous: Gold (XAUUSD) Elliott Wave Analysis

Special Trial Offer - 0.76 Cents a Day for 3 Months! Click here

Access 7 Analysts Over 170 Markets Covered. Chat Room With Support

Wheat-4Hr-commodity-...

In summary, while wheat prices have been on an upward trajectory since March 2024, we may soon experience a short-term correction. However, the broader recovery trend is expected to persist, with prices potentially reaching the 840-940 range. Traders should monitor the progression of wave (A) and prepare for the likely retracement in wave (B). By closely observing the key level of 523, traders can ensure that the bearish wave (B) does not invalidate the recovery trend. If wave (B) remains above this level, the subsequent wave (C) could present a favorable opportunity for long positions, aligning with the projected medium-term bullish correction before the resumption of the long-term bearish trend later in the year.

Related

Dell Technologies Stock Alert: DELL Elliott Wave Analysis Predicts Further Downside – Bearish Trend and Key Levels to Watch!

Dell Technologies Stock Alert: DELL Elliott Wave Analysis Predicts Further Downside – Bearish Trend and Key Levels to Watch!

Dell Technologies (DELL) is in a corrective phase, forming a five-wave structure within wave C of (4...

Read More >
Dow Jones (DJI) Elliott Wave Technical Analysis: Key Insights on Market Trends and Forecast

Dow Jones (DJI) Elliott Wave Technical Analysis: Key Insights on Market Trends and Forecast

This comprehensive Dow Jones Elliott Wave analysis examines both daily and weekly chart movements, f...

Read More >
Latest KOSPI Composite Elliott Wave Analysis with Trading Strategies, Market Trends, Bullish Forecast, and Investing Insights

Latest KOSPI Composite Elliott Wave Analysis with Trading Strategies, Market Trends, Bullish Forecast, and Investing Insights

Get an updated Elliott Wave analysis for KOSPI Composite, including trading strategies, market trend...

Read More >
Elliott Wave Analysis: VeChain (VETUSD) Technical Outlook - February 2, 2024

Elliott Wave Analysis: VeChain (VETUSD) Technical Outlook - February 2, 2024

Elliott Wave Analysis reveals potential trading opportunities for VeChain (VETUSD) on February 2, 20...

Read More >
Unlocking ASX Trading Success: SOUTH32 LIMITED – S32 Stock Analysis & Elliott Wave Technical Forecast

Unlocking ASX Trading Success: SOUTH32 LIMITED – S32 Stock Analysis & Elliott Wave Technical Forecast

Our comprehensive Elliott Wave analysis provides an in-depth look at ASX SOUTH32 (S32) stock. With a...

Read More >
Stock Analysis: The Procter & Gamble Company (PG) Elliott Wave Technical Analysis 1 March 24

Stock Analysis: The Procter & Gamble Company (PG) Elliott Wave Technical Analysis 1 March 24

In our PG Elliott Wave Analysis Trading Lounge, we provide comprehensive insights into The Procter &...

Read More >

$1 for 2 Weeks

then $29 a month!

What a Special Offer!

Trade Recommendations

Unleash the power of deversified trading with our comprehensive portfolio, covering 250+ markets:

  • Stock Trades
  • Crypto Trades
  • Forex Trades
  • Commodity Trades
Elliott Wave Analysis

Gain a competitive edge with expert insights and AI-powered Elliott Wave charting into:

  • Global Indices
  • US Stocks & ASX Stocks
  • Forex & Crypto
  • Commodities
Top-Notch Trading Tools

Equip yourself with the tools of success:

  • Real-time Chat rooms
  • Elliott Wave Algorithm
  • Portfolio tools
  • TradingLevels
  • Screener
  • Trading Game
7 Elliott Wave Analysts

Stay ahead of the market with daily charts and insightful videos
Your secret to strategic trading!

JOIN HERE


Welcome to TradingLounge (ASIC A.R.No. 321187), specialists in trades, trading education and technical analysis, covering stocks, indices, commodities, forex and cryptocurrencies.

When you join TradingLounge you have access to everything we offer, including trade tools, educational content and a social platform to chat with like-minded investors.

Read more

@Copyright 2024 by tradinglounge.com

Contact Us

Australian no: 02 4787 6020

International no: +61 (2) 47876020

Pay with:

Find us on