22Jan

THETAUSD Elliott Wave Analysis: Price Prediction, Support & Resistance Levels, and Market Trends Explained

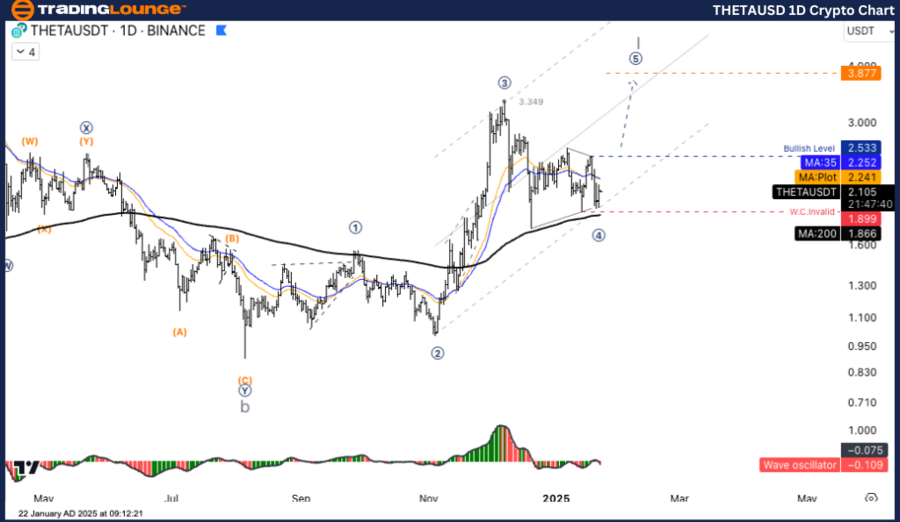
THETA/USD Elliott Wave Technical Analysis - TradingLounge – 1-Day Chart

THETA/USD (THETAUSD) Elliott Wave Technical Analysis

Function: Trend-following

Mode: Motive

Structure: Impulse

Position: Wave 5

Next Higher Degree Direction: Wave 5 of Impulse

Wave Cancelation Level: Not specified

Analysis Overview:
The ongoing price increase is part of Wave 5, aligning with the impulse structure.

THETA/USD Trading Strategy:

  • The current correction follows a Triangle pattern, signaling trend continuation.
  • The price is consolidating within a critical support level at $1.899, with an invalidation level at the same point.
  • If the price remains above $2.000 and successfully breaches the resistance at $2.533, traders can consider a long position targeting $3.877, with a stop loss placed at $1.899.

Key Market Outlook:

  • THETAUSD may continue its uptrend if the price breaks above $2.533, confirming the initiation of Wave (5).
  • The potential price target remains at $3.877, while a price drop below $1.899 may signal a shift in the current structure.

THETAUSD-1d-crypto-c...


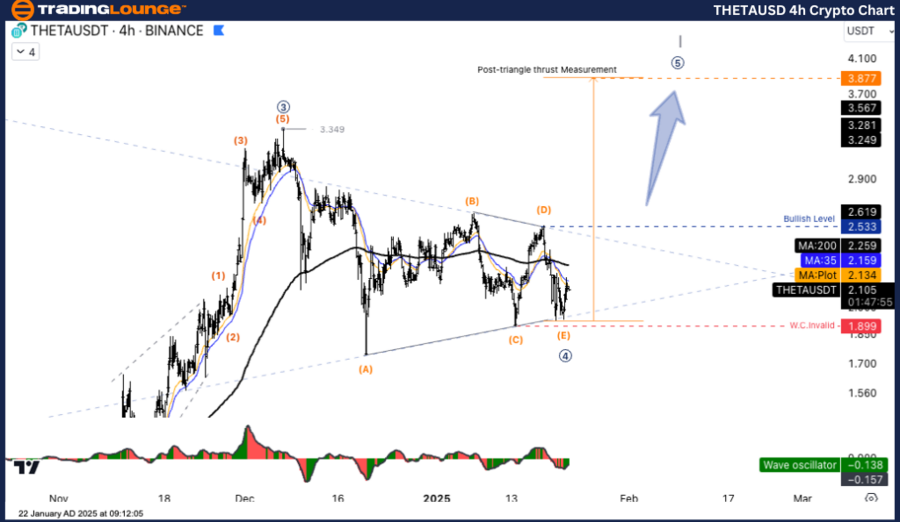
THETA/USD Elliott Wave Analysis – TradingLounge  4-Hour Chart

THETA/USD (THETAUSDT) Elliott Wave Technical Analysis

Function: Trend-following

Mode: Motive

Structure: Impulse

Position: Wave 5

Next Higher Degree Direction: Wave 5 of Impulse

Wave Cancelation Level: Not specified

Analysis Overview:
The price movement continues within Wave 5, confirming the ongoing impulse pattern.

THETA/USD Trading Strategy:

  • The correction phase follows a Triangle pattern, indicating a continuation of the trend.
  • The market remains within the Consolidation Zone, with strong support at $1.899 (wave cancellation level).
  • If the price sustains above $2.000 and surpasses the resistance at $2.533, a long trade can be initiated with an upside target of $3.877, and a stop loss at $1.899.

Key Market Outlook:

  • A breakout above $2.533 will validate the uptrend continuation towards $3.877 in Wave (5).
  • A decline below $1.899 may suggest a reversal and invalidate the current wave structure.

Technical Analyst: Kittiampon Somboonsod

Source: visit Tradinglounge.com and learn From the Experts Join TradingLounge Here 

Previous: BTCUSD Elliott Wave Technical Analysis

VALUE Offer - Buy 1 Month & Get 3 Months!Click here

Access 7 Analysts Over 200 Markets Covered. Chat Room With Support

THETAUSD-4h-crypto-c...

Related

U.S.Dollar/Swiss Franc (USD/CHF) Forex Elliott Wave Technical Analysis: Precise Forex Trading Strategies

U.S.Dollar/Swiss Franc (USD/CHF) Forex Elliott Wave Technical Analysis: Precise Forex Trading Strategies

This article provides a comprehensive USD/CHF Elliott Wave Analysis, detailing impulsive wave patter...

Read More >
AAVEUSD Elliott Wave Technical Analysis: Detailed Price Prediction, A-B-C Pattern, and Expert Trading Strategies

AAVEUSD Elliott Wave Technical Analysis: Detailed Price Prediction, A-B-C Pattern, and Expert Trading Strategies

Elliott Wave analysis for AAVE/USD, focusing on Wave IV correction patterns, price predictions, and ...

Read More >
WTI Crude Oil Commodity Elliott Wave Technical Analysis Explores the Current Market Trends using Elliott Wave theory

WTI Crude Oil Commodity Elliott Wave Technical Analysis Explores the Current Market Trends using Elliott Wave theory

This detailed WTI Crude Oil analysis explores the current market trends using Elliott Wave theory. W...

Read More >
Soybean Elliott Wave Technical Analysis: Market Trend Insights, and Bearish Wave Pattern for Soybean Futures Trading

Soybean Elliott Wave Technical Analysis: Market Trend Insights, and Bearish Wave Pattern for Soybean Futures Trading

Soybean Elliott Wave Analysis, offering insights into price trends, wave patterns, and market foreca...

Read More >
Copper Elliott Wave Technical Analysis: Market Analysis through Elliott Wave Perspective

Copper Elliott Wave Technical Analysis: Market Analysis through Elliott Wave Perspective

Copper's price action suggests a complex corrective phase within a key resistance area, possibl...

Read More >
NIKKEI 225(N225) Indices Elliott Wave Technical Analysis: Breaks down both daily and weekly market movements

NIKKEI 225(N225) Indices Elliott Wave Technical Analysis: Breaks down both daily and weekly market movements

This detailed analysis of the NIKKEI 225 index through the lens of Elliott Wave theory breaks down b...

Read More >

Buy 1 Month

Get 3 Months!

Special Offer:

Trade Recommendations

Unleash the power of deversified trading with our comprehensive portfolio, covering:

  • Stock Trades
  • Crypto Trades
  • Forex Trades
  • Commodity Trades
Elliott Wave Analysis

Gain a competive edge with expert insights in to:

  • Global Indices
  • US Stocks & ASX Stocks
  • Forex & Crypto
  • Commodities
Top-Notch Trading Tools

Equip yourself with the tools of success:

  • Social Chat
  • Elliott Wave Algorithm
  • Screener
  • TradingLevels
  • Trading Game
7 Elliott Wave Analysts

Stay ahead of the market with daily charts and insightful videos
-Your secret to strategic trading!

JOIN HERE


Welcome to TradingLounge (ASIC A.R.No. 321187), specialists in trades, trading education and technical analysis, covering stocks, indices, commodities, forex and cryptocurrencies.

When you join TradingLounge you have access to everything we offer, including trade tools, educational content and a social platform to chat with like-minded investors.

Read more

@Copyright 2024 by tradinglounge.com

Contact Us

Australian no: 02 4787 6020

International no: +61 (2) 47876020

Pay with:

Find us on