S&P BSE Sensex (India) Elliott Wave Analysis – TradingLounge Day Chart
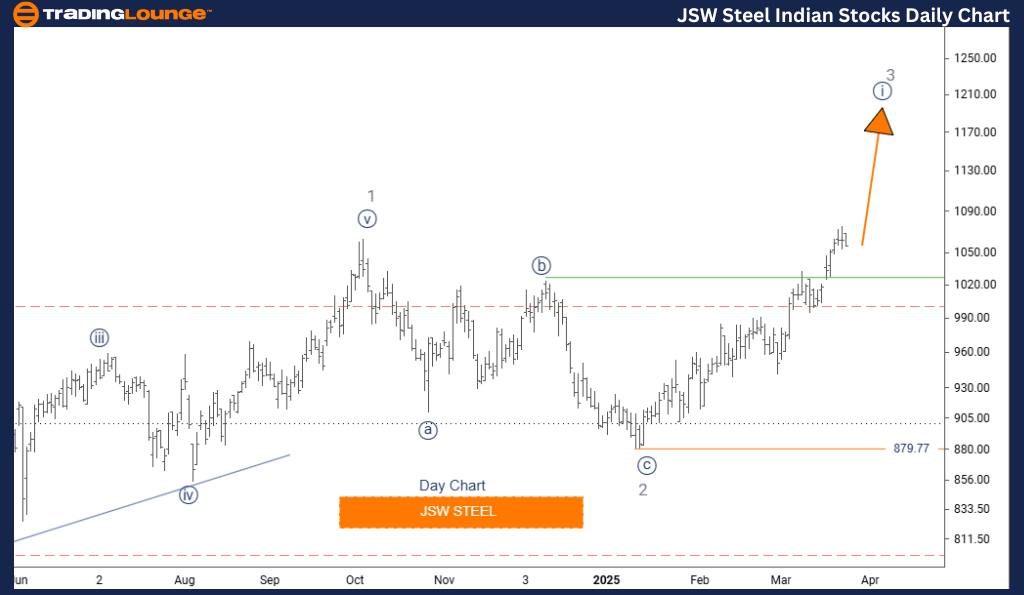
JSW STEEL Day Chart Analysis
JSW STEEL – Elliott Wave Technical Analysis
Function: Bullish Trend
Mode: Impulsive
Structure: Navy Blue Wave 1
Position: Gray Wave 3
Direction Next Lower Degrees: Navy Blue Wave 2
Wave Cancel Invalid Level: 879.77
The Elliott Wave analysis of JSW Steel's daily chart indicates a strong bullish trend with an impulsive upward structure in development. This movement is initiated by navy blue wave 1, which is embedded within a larger gray wave 3 framework.
Technical analysts confirm that gray wave 2’s correction phase is now complete, and the stock is entering navy blue wave 1 of 3. This wave often signifies the early stages of a powerful price rally according to Elliott Wave Theory.
The critical invalidation level is marked at 879.77. If price falls below this threshold, it would invalidate the current bullish scenario. The daily chart structure helps short-term traders identify actionable signals within the broader wave pattern.
Upon completion of navy blue wave 1, a minor correction is expected in navy blue wave 2, followed by a continuation into navy blue wave 3, typically the most aggressive leg in an impulsive sequence.
This Elliott Wave setup offers short-term trading potential and aligns with a larger trend-based strategy for participating in the expected long-term bullish movement. Traders should observe for classic impulsive behavior such as increased volume, strong momentum, and rapid price action.
Maintaining long positions remains consistent with the prevailing trend, though managing risk near the 879.77 invalidation level is crucial for protecting capital.
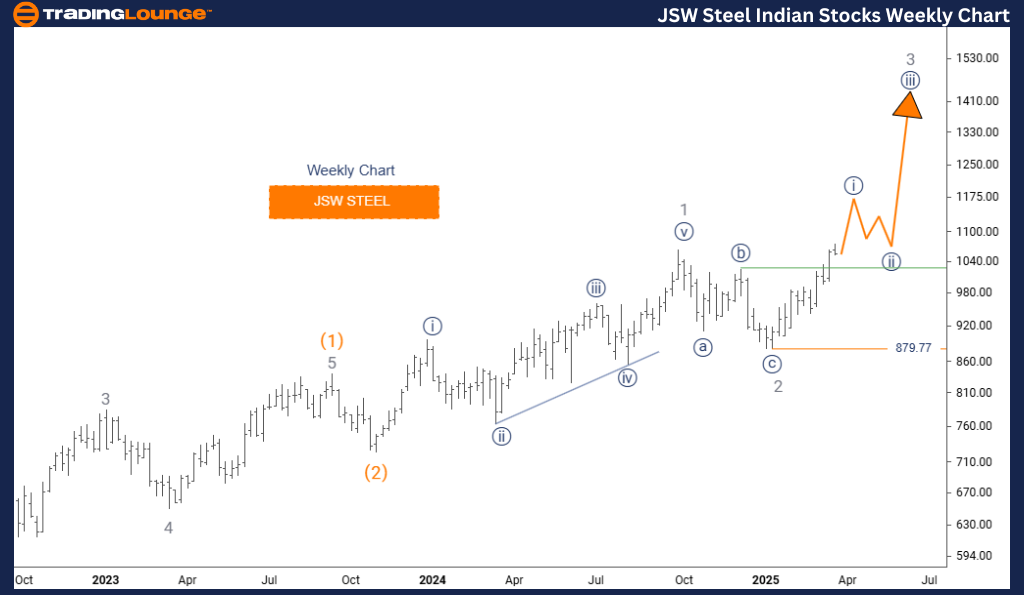
JSW STEEL Elliott Wave Analysis – TradingLounge Weekly Chart
JSW STEEL Elliott Wave Technical Analysis
Function: Bullish Trend
Mode: Impulsive
Structure: Navy Blue Wave 1
Position: Gray Wave 3
Direction Next Lower Degrees: Navy Blue Wave 2
Wave Cancel Invalid Level: 879.77
The Elliott Wave analysis for JSW Steel on the weekly chart supports a long-term bullish outlook, with the stock progressing within a gray wave 3 uptrend. The current structure is defined by navy blue wave 1, indicating a larger impulsive advance.
Analysts have identified the completion of gray wave 2, marking the beginning of navy blue wave 1 of 3, which generally leads to sustained upward momentum in extended rallies, especially relevant in commodity-linked sectors like steel.
The invalidation level remains at 879.77, serving as a key risk threshold for investors. A break below this would question the ongoing bullish wave formation. The weekly timeframe offers clarity for long-term investors following the evolution of this wave structure.
Navy blue wave 1 represents not just a medium-term move, but also a launch point for potential broader upside within the context of gray wave 3. Elliott Wave cycles suggest that wave 3 phases typically deliver stronger price acceleration and trend continuation.
Market participants should track this structure using volume confirmation and clear impulsive patterns to validate the setup. While the broader wave favors continued long positioning, managing risk near the invalidation level remains essential.
This technical outlook for JSW Steel offers actionable insight for both active traders and long-term investors, with the wave alignment supporting exposure to both near-term opportunity and strategic growth trends in the steel sector.
Technical Analyst: Malik Awais
Source: visit Tradinglounge.com and learn From the Experts Join TradingLounge Here
Previous: COAL INDIA Elliott Wave Technical Analysis
VALUE Offer - Buy 1 Month & Get 3 Months!Click here
Access 7 Analysts Over 200 Markets Covered. Chat Room With Support