Caterpillar Inc. (CAT) Elliott Wave Analysis for Daily and 1-Hour Charts
This analysis evaluates the current trend structure of Caterpillar Inc. (CAT) through Elliott Wave Theory applied to the daily and 1-hour charts. Below is a detailed outlook on the stock's position and potential future moves.
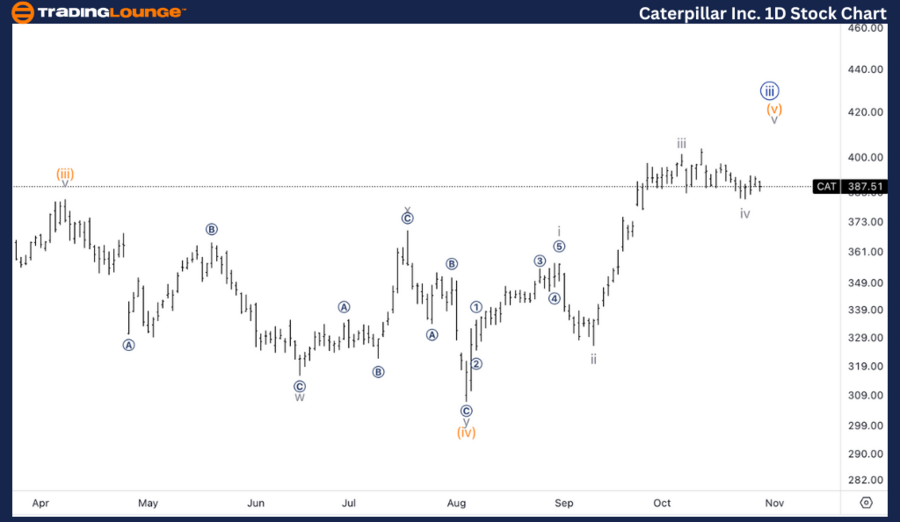
CAT Elliott Wave Analysis - TradingLounge Daily Chart
Caterpillar Inc. (CAT) Daily Chart Analysis
CAT Elliott Wave Technical Analysis
Technical Overview
Trend Type: Trend
Wave Mode: Impulsive
Wave Structure: Motive
Current Position: Wave {iii}
Forecasted Direction: Upward in wave (v) of {iii}
Analysis Details:
The daily chart shows Caterpillar in wave {iii}, with an emphasis on completing wave (v). This wave (v) might also mark the start of wave i of (v), indicating potential for further upside beyond initial projections. Traders should stay alert for continued upward momentum as this wave develops.

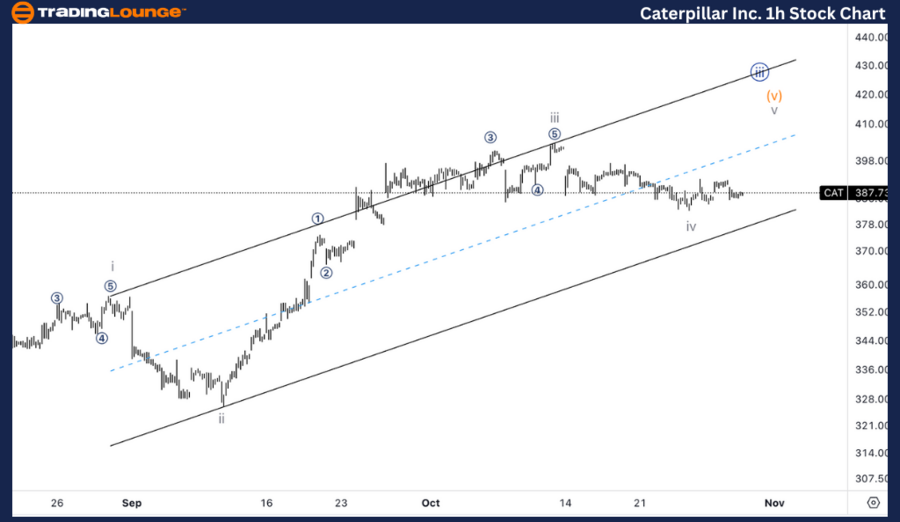
CAT Elliott Wave Analysis - TradingLounge 1-Hour Chart
Caterpillar Inc. (CAT) 1-Hour Chart Analysis
Technical Overview
Trend Type: Trend
Wave Mode: Impulsive
Wave Structure: Motive
Current Position: Wave iv
Forecasted Direction: Sideways in wave iv
Analysis Details:
The 1-hour chart displays a corrective sideways movement in wave iv, alternating well with the prior wave ii. As CAT moves closer to the parallel trend channel, support is expected, potentially resuming the upward trend. This phase of consolidation could be a strategic entry point for traders looking to initiate or expand positions.
Technical Analyst: Alessio Barretta
Source: visit Tradinglounge.com and learn From the Experts Join TradingLounge Here
See Previous: Costco Wholesale Corp. (COST) Elliott Wave Technical Analysis
VALUE Offer - Buy 1 Month & Get 3 Months!Click here
Access 7 Analysts Over 200 Markets Covered. Chat Room With Support
