WTI Elliott Wave Analysis
In the realm of Elliott Wave Theory, WTI (West Texas Intermediate) oil charts a fascinating journey, revealing intricate patterns that guide our understanding of market dynamics. Currently, the oil market is exhibiting counter-trend behavior within a corrective phase, characterized by a Zigzag structure. Let's delve deeper into the analysis.
WTI CrudeOil Elliott Wave Analysis
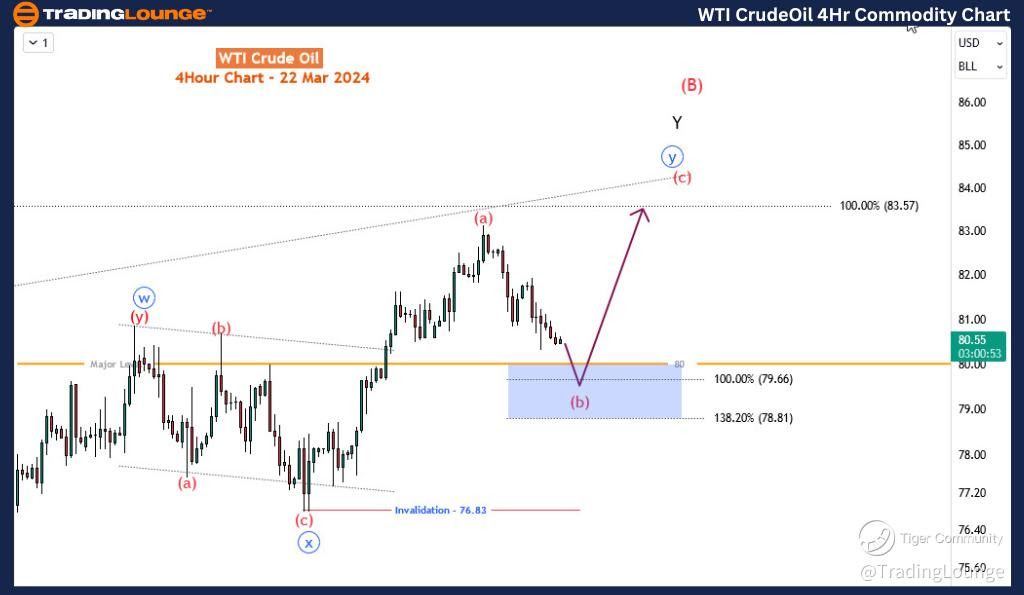
WTI CrudeOil Elliott Wave Technical Analysis
Function - Counter-trend
Mode - Corrective
Structure - Zigzag
Position - Wave (b) of ‘y’
Direction - Wave (c) of ‘y’
Details - A pullback for (b) is now close to the 80 major levels. A rebound is expected from the marked zone (80-78.8) for wave (c) toward 83.
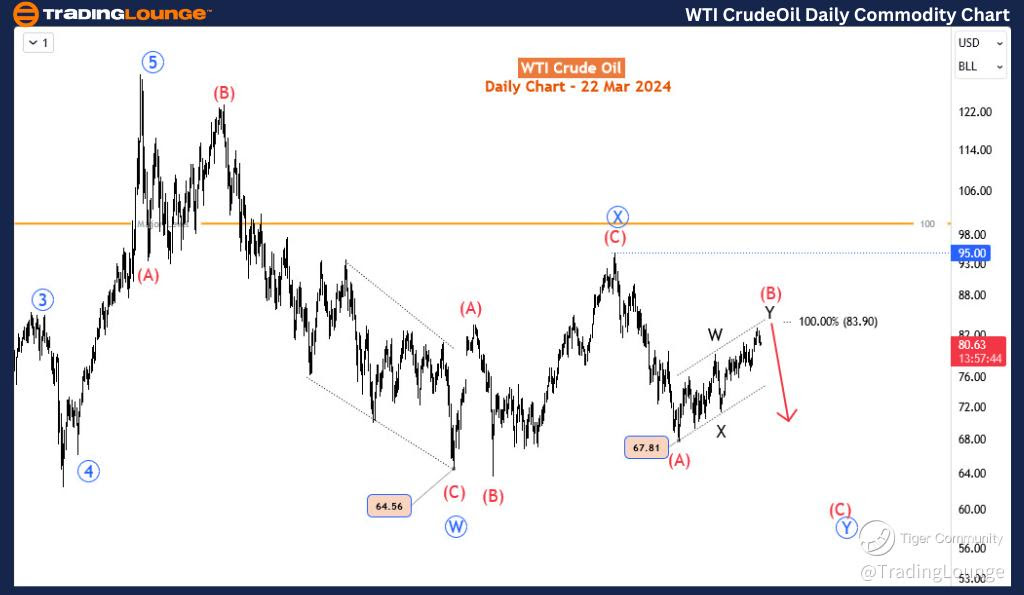
Since December 2013, WTI has gained over 18%, which marks a decent recovery following the 28% slump from September to December 2023. However, this recovery only constitutes about 60% of the slump and is corrective. We anticipate that once the correction concludes, the slump from September 2023 will likely resume and possibly extend below $65. In such a scenario, oil would have shed half or more of its value since its peak at $130.5 in March 2022. The Elliott Wave principle can provide insights into whether this recovery has concluded, considering the broader context since March 2022.
WTI CrudeOil Daily Chart Analysis:
On the daily timeframe, the oil market resides within a long-term corrective phase of the bullish trend that commenced in March 2022 following the remarkable rebound from the Covid-induced downturn. This corrective phase exhibits bearish characteristics and appears to be forming a double zigzag pattern from $130.55. The initial leg of the zigzag, denoted as wave W (encircled in blue), concluded in March 2023, followed by a resurgence for the corresponding wave X (also encircled in blue), which completed around $95 in September 2023. Subsequently, another three-wave decline for wave Y (blue-circled) is currently unfolding. Sub-wave (A) terminated just below $68 in December 2023, leading to the ongoing rebound for sub-wave (B). This wave (B) is also shaping as a double zigzag and is nearing the conclusion of its 3rd leg - wave Y.
WTI CrudeOil Elliott Wave Analysis Trading Lounge 4-Hour Chart
WTI CrudeOil 4-Hour Chart Analysis:
WTI Crude Oil Technical Forecast
On the H4 timeframe, we presently find ourselves within wave (b) of y of Y of (B) - the waves preceding the final leg. Wave (b) is approaching a crucial major level at 80, or the 80-78.8 zone just below it. We anticipate this level or zone to provide support for (b). Subsequently, wave (c) is expected to initiate shortly, targeting prices above $84. However, (b) may deviate lower than anticipated or potentially fail to reach the key zone, yet it should ideally remain above 76.83. A breach below 76.83 could signify that (B) has already concluded, and the bullish correction from December 12 might have peaked between $83.1
In conclusion, navigating the complexities of the WTI oil market requires a comprehensive understanding of the Elliott Wave Theory. By deciphering the intricate patterns and wave structures, analysts can gain valuable insights into potential market movements, aiding in informed decision-making. Stay tuned as we continue to monitor and analyze the unfolding trends in the dynamic world of oil trading.
Technical Analyst: Sanmi Adeagbo
Source: visit Tradinglounge.com and learn From the Experts Join TradingLounge Here
See Previous: Cocoa
TradingLounge Once Off SPECIAL DEAL: Here > 1 month Get 3 months.