Introduction: Unveiling the Potential of Cocoa's Market Surge
In the intricate dance of commodity markets, Cocoa stands out with its impressive upward trajectory. As we delve into the Cocoa Elliott Wave Analysis, it becomes evident that we are witnessing a significant bullish phase. This analysis aims to decode the market's current stance through the lens of the Elliott Wave Theory, offering insights into potential future movements and strategic entry points for traders and investors.
Cocoa Elliott Wave Analysis
Cocoa Elliott Wave Technical Analysis
Function - Trend
Mode - Impulsive
Structure - Impulse Wave
Position - Blue wave v of 5 of (C)
Direction - Upwards as Blue wave v of 5 of (C) progresses
Details - Wave (iv) retracement completed at the top of the reversal zone we marked. Wave (v) could be heading for 9000.
Cocoa is about to make a new all-time high for the fourth time this year. In 2023, it closed with a massive 62% gain. However, this year, it has almost doubled in price since 1st January and we are still in March. It’s one of the best-performing financial instruments in the last 1 year. It broke above $8,000 early in the week and now could be heading to $9,000 after it completely recovers from the 18-19 March minor dip. But how far further upside could it go? Will there be a big pullback soon? How can traders take advantage of this big bullish trend? This technical analysis provides clues from the Elliott wave theory.
In the long term, the bullish trend didn’t start in 2023. It started properly in 2001 when the commodity barely traded at $709. Before the bullish trend was a multi-year decline. We will dwell more on when the trend started. In the last 22-23 years of this trend, the commodity only had major pullbacks in 2003 extended to 2004/05 before the trend continued for the next four years. Another pullback started in 2011 and lasted till 2017 before the currency phase of the bullish trend. From 2017, by projection, Cocoa could hit the 100% extension ($9,500) of the rally between 2001-to-2011 from the end of the pullback in 2017.
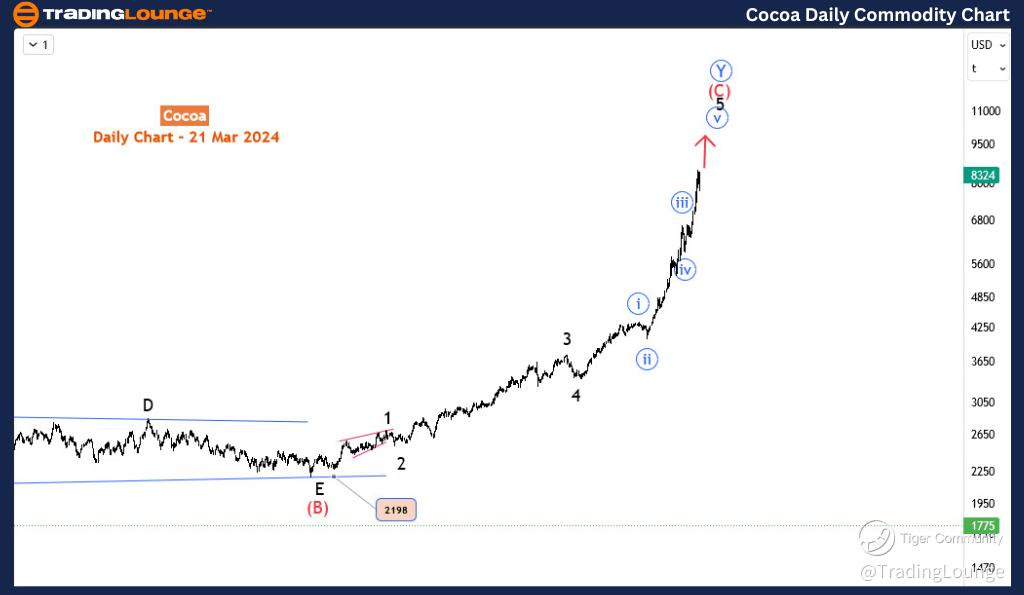
Cocoa Daily Chart Analysis:
On the daily chart, an Elliott wave analysis of the trend from September 2022 suggests we are in the last wave i.e. wave 5 of (C). Meanwhile, the sub-wave ‘v’ (in blue) of 5 is not yet completed and could hit $9,500. This is going to be the next target for Cocoa in both the medium and short term.
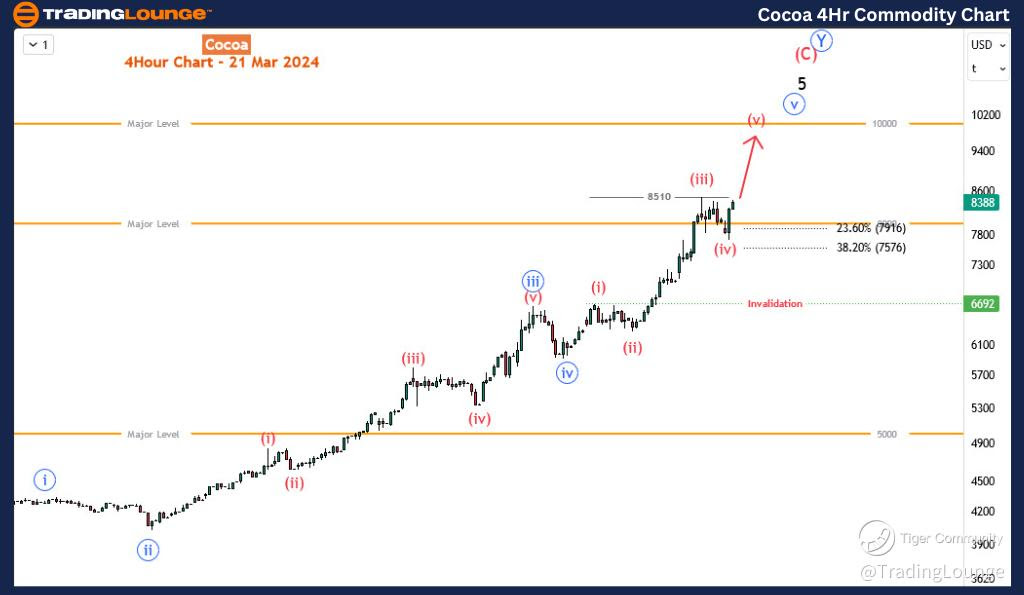
Cocoa Elliott Wave Analysis Trading Lounge 4-Hour Chart
Cocoa 4-Hour Chart Analysis:
Cocoa Price Market Dynamics: Navigating the Waves
On the H4, blue wave ‘v’ (circled) has completed its sub-wave (iv). Wave (v) has emerged and should break above $8510 high toward the 9500 target and even the $10,000 major level. Will there be a bigger pullback from there or the trend will extend higher? The price action afterwards will tell.
Conclusion: The Road Ahead for Cocoa Prices
The Cocoa Elliott Wave Analysis presents a compelling narrative of growth, resilience, and potential. As the market navigates through the intricacies of wave patterns, the bullish trend offers a beacon for strategic investments and trading decisions. With the potential to breach new heights, cocoa's market dynamics beckon investors and traders to harness the insights provided by the Elliott Wave Theory, positioning themselves advantageously in the unfolding bullish saga.
Technical Analyst: Sanmi Adeagbo
Source: visit Tradinglounge.com and learn From the Experts Join TradingLounge Here
See Previous: Wheat
TradingLounge Once Off SPECIAL DEAL: Here > 1 month Get 3 months.