18Mar

VeChain (VET) Elliott Wave Analysis: Crypto Trading Strategy, Market Trends, Support & Resistance Levels for VET/USD

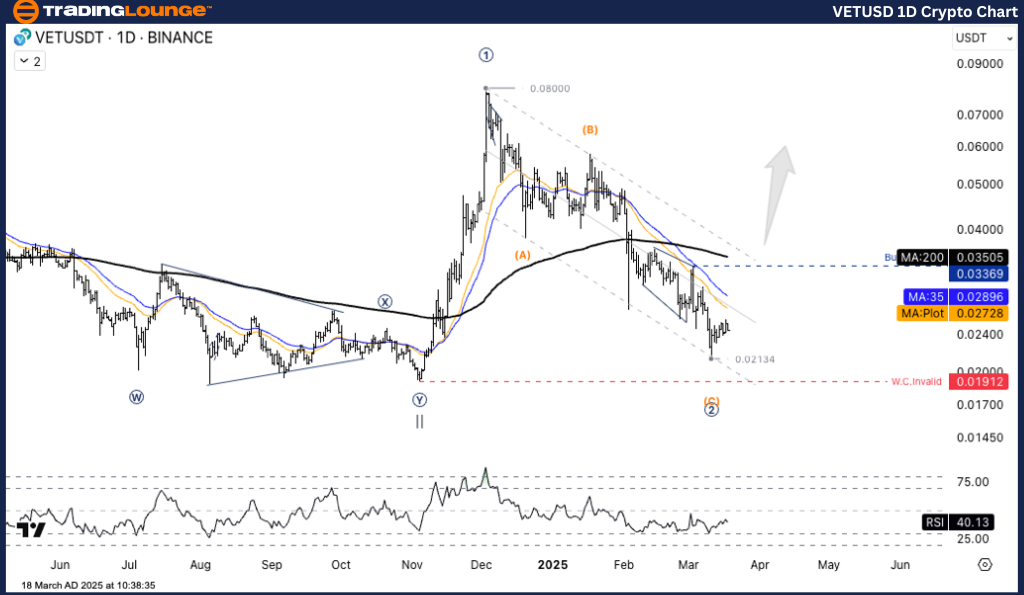
VET/USD (VeChain to U.S. Dollar) Elliott Wave Analysis – TradingLounge Daily Chart

VETUSD Elliott Wave Technical Analysis

Function: Counter-trend

Mode: Corrective

Structure: Zigzag

Position: Wave (C)

Next Higher Degree Direction: Wave ((2)) of Impulse

Wave Cancellation Invalid Level: $0.01907

Market Overview:

VeChain (VET) has been navigating an extended correction phase, aligning with its Elliott Wave structure. Currently, it is entering a crucial zone that may signal the start of a new uptrend.

VET/USD Trading Strategy

Following its peak at $0.08000, VET entered a corrective wave (A)-(B)-(C). The latest wave (C) has seemingly found a bottom at $0.02134, marking a potential end to wave (2).

Currently, signs of recovery are evident, with a significant resistance level at $0.03369. The primary Elliott Wave sequence has completed waves I–II, and wave (2) appears to have concluded at $0.02134. The market is now transitioning into the early stages of an uptrend in wave 1.

Key Confirmation Point

If VET/USD sustains a price above $0.03369, it will confirm the completion of wave (2) and validate a potential bullish trend.

Trading Strategies

For Short-Term Traders (Swing Trading):

Uptrend Confirmation: If the price breaks above $0.03369, an accelerated bullish movement is expected.

Target Levels:

  • First Target: $0.04500
  • Next Target: $0.06500

📉 Risk Management:

If the price drops below $0.02134 and breaches the Wave Cancellation Invalid Level at $0.01912, the current Elliott Wave structure will be invalidated.

VETUSD-1d-crypto-cha...


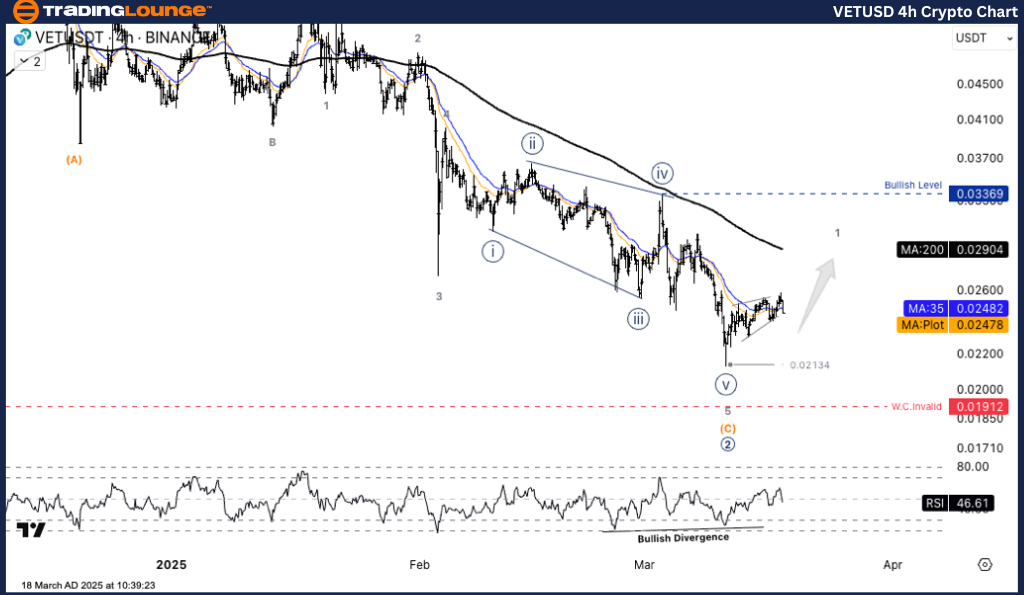
VET/USD (VeChain to U.S. Dollar) Elliott Wave Analysis – TradingLounge H4 Chart

VETUSD Elliott Wave Technical Analysis

Function: Counter-trend

Mode: Corrective

Structure: Zigzag

Position: Wave (C)

Next Higher Degree Direction: Wave ((2)) of Impulse

Wave Cancellation Invalid Level: $0.01907

Market Overview:

VeChain (VET) has been undergoing a prolonged correction and is now approaching a critical juncture where its Elliott Wave structure suggests the potential start of an uptrend.

VET/USD Trading Strategy

After reaching a high of $0.08000, VET underwent a strong correction in an (A)-(B)-(C) wave pattern. Wave (C) appears to have bottomed out at $0.02134, marking the end of wave (2).

Currently, the market is showing signs of recovery, with a major resistance at $0.03369. The primary Elliott Wave structure has completed waves I–II, and wave (2) likely ended at $0.02134. The market now appears to be in the early phase of wave 1 uptrend.

Key Confirmation Point

A sustained move above $0.03369 would confirm wave (2) completion and validate an uptrend continuation.

Trading Strategies

For Short-Term Traders (Swing Trading):

Uptrend Confirmation: If VET/USD breaks $0.03369, a sharp price increase is expected.

Target Levels:

  • First Target: $0.04500
  • Next Target: $0.06500

📉 Risk Management:

If the price declines below $0.02134 and breaches the Wave Cancellation Invalid Level at $0.01912, the Elliott Wave structure will be invalidated.

Technical Analyst: Kittiampon Somboonsod

Source: Visit Tradinglounge.com and learn from the Experts. Join TradingLounge Here 

Previous: BTCUSD Elliott Wave Technical Analysis

VALUE Offer - Buy 1 Month & Get 3 Months!Click here

Access 7 Analysts Over 200 Markets Covered. Chat Room With Support

VETUSD-4h-crypto-cha...

Related

Berkshire Hathaway Inc.(BRK.B:NYSE) Elliott Wave Technical Analysis 10 November 23

Berkshire Hathaway Inc.(BRK.B:NYSE) Elliott Wave Technical Analysis 10 November 23

Berkshire Hathaway Inc.(BRK.B:NYSE) Elliott Wave Technical Analysis 10 November 23 shows Stock Marke...

Read More >
V300AEQ ETF UNITS – VAS Stock Analysis & Vanguard Elliott Wave Technical Forecast

V300AEQ ETF UNITS – VAS Stock Analysis & Vanguard Elliott Wave Technical Forecast

Our latest Elliott Wave analysis on ASX: V300AEQ ETF Units – VAS reveals that wave 2-red has conclu...

Read More >
Hang Seng Index Elliott Wave Analysis: HSI Market Outlook, Bullish Trend, Trading Strategy, Price Prediction & Technical Insights

Hang Seng Index Elliott Wave Analysis: HSI Market Outlook, Bullish Trend, Trading Strategy, Price Prediction & Technical Insights

Hang Seng Index Elliott Wave analysis provides an in-depth HSI market outlook, focusing on wave stru...

Read More >
New Zealand Dollar/U.S.Dollar (NZDUSD) Elliott Wave Technical Analysis 7 December 23

New Zealand Dollar/U.S.Dollar (NZDUSD) Elliott Wave Technical Analysis 7 December 23

NZDUSD Elliott Wave Analysis Trading Lounge Day Chart dated 7 December 23, provides a comprehensive ...

Read More >
Understand how Elliott Wave Theory Applies to DIS Stock's Future Trajectory: The Walt Disney Co. Technical Analysis

Understand how Elliott Wave Theory Applies to DIS Stock's Future Trajectory: The Walt Disney Co. Technical Analysis

Explore an in-depth Elliott Wave analysis of The Walt Disney Co. (DIS), highlighting current price m...

Read More >
Elliott Wave Technical analysis of PayPal Holdings Inc. (PYPL) Stock Highlighting the Current Market Structure and Movements

Elliott Wave Technical analysis of PayPal Holdings Inc. (PYPL) Stock Highlighting the Current Market Structure and Movements

This article provides a comprehensive Elliott Wave analysis of PayPal Holdings Inc. (PYPL), highligh...

Read More >

Buy 1 Month

Get 3 Months!

Special Offer:

Trade Recommendations

Unleash the power of deversified trading with our comprehensive portfolio, covering:

  • Stock Trades
  • Crypto Trades
  • Forex Trades
  • Commodity Trades
Elliott Wave Analysis

Gain a competive edge with expert insights in to:

  • Global Indices
  • US Stocks & ASX Stocks
  • Forex & Crypto
  • Commodities
Top-Notch Trading Tools

Equip yourself with the tools of success:

  • Social Chat
  • Elliott Wave Algorithm
  • Screener
  • TradingLevels
  • Trading Game
7 Elliott Wave Analysts

Stay ahead of the market with daily charts and insightful videos
-Your secret to strategic trading!

JOIN HERE


Welcome to TradingLounge (ASIC A.R.No. 321187), specialists in trades, trading education and technical analysis, covering stocks, indices, commodities, forex and cryptocurrencies.

When you join TradingLounge you have access to everything we offer, including trade tools, educational content and a social platform to chat with like-minded investors.

Read more

@Copyright 2024 by tradinglounge.com

Contact Us

Australian no: 02 4787 6020

International no: +61 (2) 47876020

Pay with:

Find us on