19May

Mastercard Inc. (MA) Elliott Wave Analysis Shows Bullish Wave 3 Targeting $595 and $650 Key Resistance Levels for Traders

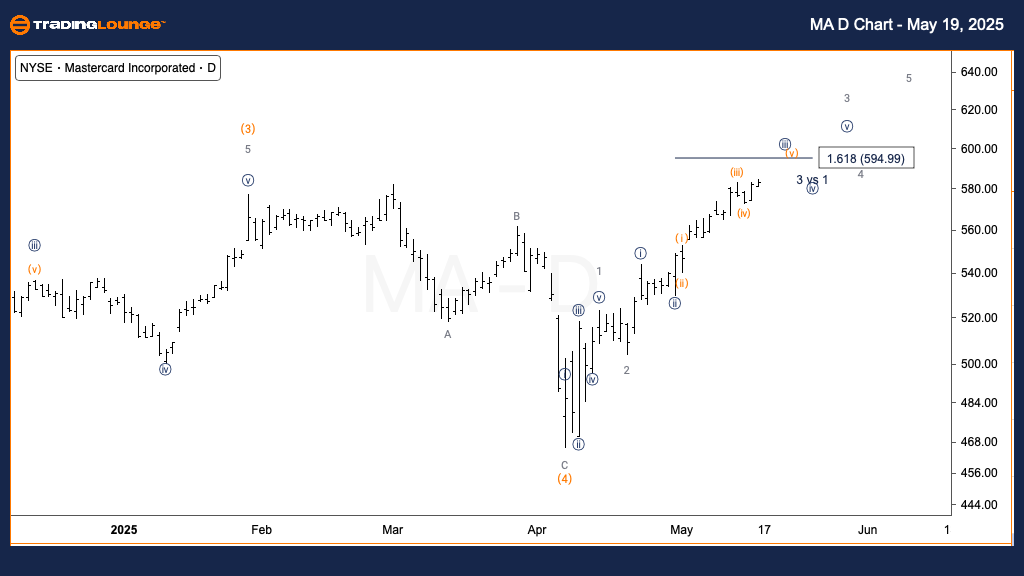
Mastercard Inc. (MA) Elliott Wave Analysis – Trading Lounge Daily Chart

MA Elliott Wave Technical Analysis

Function: Trend

Mode: Impulsive

Structure: Motive

Position: Wave 3

Direction: Bullish continuation in Wave 3

Technical Overview:

Mastercard (MA) is progressing within Minor Wave 3, indicating strong bullish momentum.

Price action is currently targeting the lower range of Minor Group 2, near the $650 mark, a key resistance level that may challenge the ongoing uptrend.

The current impulsive wave structure suggests a sustained bullish outlook, reinforcing upward price targets in line with Elliott Wave forecasting.

Mastercard-d-chart-1...


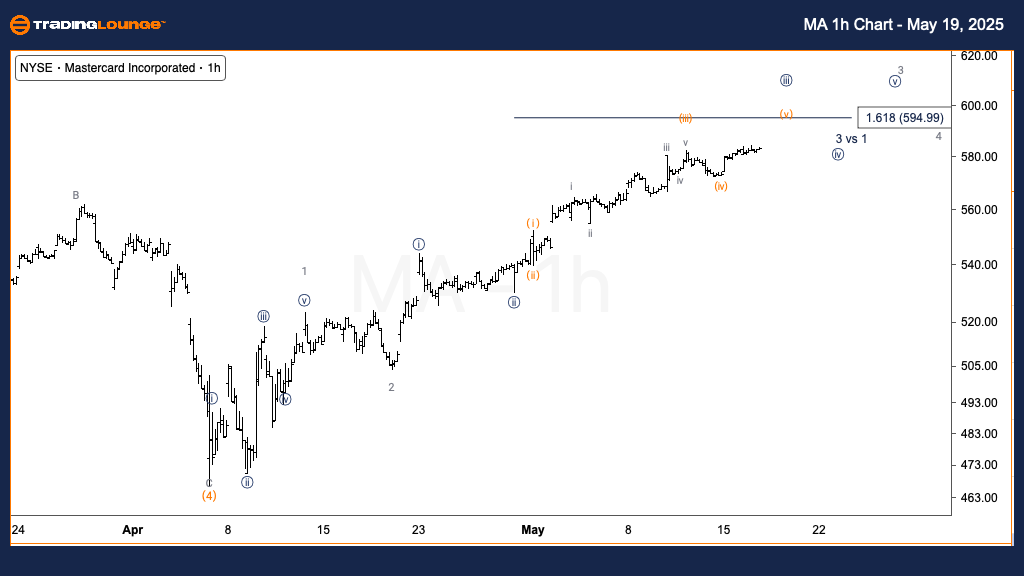
Mastercard Inc. (MA) Elliott Wave Analysis – Trading Lounge 1H Chart

MA Elliott Wave Technical Analysis

Function: Trend

Mode: Impulsive

Structure: Motive

Position: Wave {iii} of 3

Direction: Approaching Wave {iii} peak

Technical Overview:

Mastercard (MA) appears to be nearing the completion of Wave {iii} within Minor Wave 3.

The price is closely approaching the 1.618 Fibonacci extension level of Wave {i}, around $595. This region may serve as a resistance zone and could prompt a corrective pullback in Wave {iv}.

Short-term traders should monitor for consolidation or reversal signals before the next impulsive advance resumes.

Technical Analyst: Alessio Barretta

Source: Visit Tradinglounge.com and learn from the Experts. Join TradingLounge Here 

Previous: Advanced Micro Devices Inc. (AMD) Elliott Wave Technical Analysis

VALUE Offer - Buy 1 Month & Get 3 Months!Click here

Access 7 Analysts Over 200 Markets Covered. Chat Room With Support

Mastercard-1h-chart-...


Summary
This Elliott Wave analysis of Mastercard (MA) combines insights from both the daily and intraday (1H) charts. The current wave structure supports a strong upward trajectory. Price zones near $595 and $650 are critical, as they may determine the timing and strength of upcoming wave completions. These technical levels are crucial for short-term trading setups and long-term positioning, aligned with Elliott Wave strategy and market timing principles.

Related

Visa Inc. (V) Stocks Elliott Wave Technical Analysis: Key Price Levels and Stock Forecast for Bullish Momentum

Visa Inc. (V) Stocks Elliott Wave Technical Analysis: Key Price Levels and Stock Forecast for Bullish Momentum

This analysis provides a detailed Elliott Wave interpretation for Visa Inc. (V), covering both the d...

Read More >
Bitcoin/U.S. dollar(BTCUSD) Elliott Wave Technical Analysis 29 January 24

Bitcoin/U.S. dollar(BTCUSD) Elliott Wave Technical Analysis 29 January 24

Bitcoin and U.S. dollar(BTCUSD) Elliott Wave Technical Analysis dated 29 January 24, Day and 4-hour ...

Read More >
HCL TECHNOLOGIES Indian Stocks Elliott Wave Technical Analysis and Stock Forecast: Learn About Price Predictions and Invalidation Points

HCL TECHNOLOGIES Indian Stocks Elliott Wave Technical Analysis and Stock Forecast: Learn About Price Predictions and Invalidation Points

Get a comprehensive analysis of HCL Technologies (HCLTECH) using Elliott Wave theory. Learn about pr...

Read More >
Eaton Corp. PLC (ETN) Stocks Elliott Wave Technical Analysis: Focusing on its technical patterns through daily and 4-hour charts.

Eaton Corp. PLC (ETN) Stocks Elliott Wave Technical Analysis: Focusing on its technical patterns through daily and 4-hour charts.

This article provides a comprehensive Elliott Wave analysis of Eaton Corp. PLC (ETN), focusing on it...

Read More >
Apple Inc. (AAPL) Stocks Elliott Wave Technical Analysis: Forecast and Insights

Apple Inc. (AAPL) Stocks Elliott Wave Technical Analysis: Forecast and Insights

Explore our detailed analysis of Apple Inc. (AAPL) using Elliott Wave Theory. Understand the current...

Read More >
Bharat Electricals Stock Analysis – BEL Stocks Elliott Wave Technical Analysis Including Daily and 4H Chart Insights

Bharat Electricals Stock Analysis – BEL Stocks Elliott Wave Technical Analysis Including Daily and 4H Chart Insights

This article provides a comprehensive Elliott Wave analysis of Bharat Electricals (BEL) stock, inclu...

Read More >

$1 for 2 Weeks

then $29 a month!

What a Special Offer!

Trade Recommendations

Unleash the power of deversified trading with our comprehensive portfolio, covering 250+ markets:

  • Stock Trades
  • Crypto Trades
  • Forex Trades
  • Commodity Trades
Elliott Wave Analysis

Gain a competitive edge with expert insights and AI-powered Elliott Wave charting into:

  • Global Indices
  • US Stocks & ASX Stocks
  • Forex & Crypto
  • Commodities
Top-Notch Trading Tools

Equip yourself with the tools of success:

  • Real-time Chat rooms
  • Elliott Wave Algorithm
  • Portfolio tools
  • TradingLevels
  • Screener
  • Trading Game
7 Elliott Wave Analysts

Stay ahead of the market with daily charts and insightful videos
Your secret to strategic trading!

JOIN HERE


Welcome to TradingLounge (ASIC A.R.No. 321187), specialists in trades, trading education and technical analysis, covering stocks, indices, commodities, forex and cryptocurrencies.

When you join TradingLounge you have access to everything we offer, including trade tools, educational content and a social platform to chat with like-minded investors.

Read more

@Copyright 2024 by tradinglounge.com

Contact Us

Australian no: 02 4787 6020

International no: +61 (2) 47876020

Pay with:

Find us on