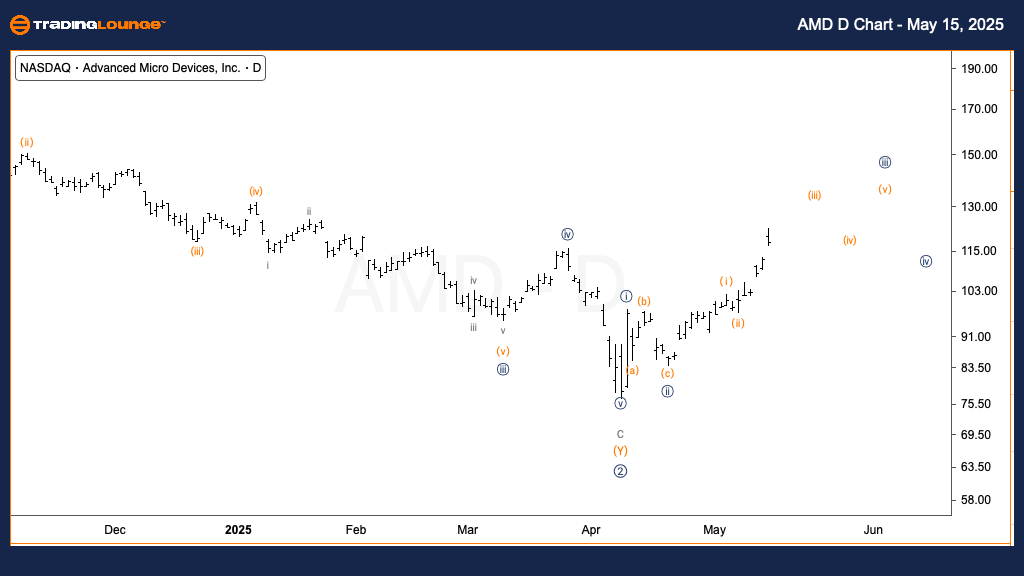
AMD Elliott Wave Analysis – Trading Lounge Daily Chart
Advanced Micro Devices Inc. (AMD) – Daily Chart
AMD Elliott Wave Technical Outlook
FUNCTION: Trend
MODE: Impulsive
STRUCTURE: Motive
POSITION: Wave (iii) of {iii}
DIRECTION: Uptrend within wave {iii}
DETAILS:
On the daily chart, Advanced Micro Devices Inc. (AMD) is sustaining its bullish trend, currently advancing in wave (iii) of Minute wave {iii}, or alternatively, wave {c} under a conservative interpretation. The Elliott Wave structure supports continued upward momentum, with a short-term price target near the $150 resistance zone—identified as a key Medium Level. This level is crucial for traders watching for the next breakout or pullback scenario.
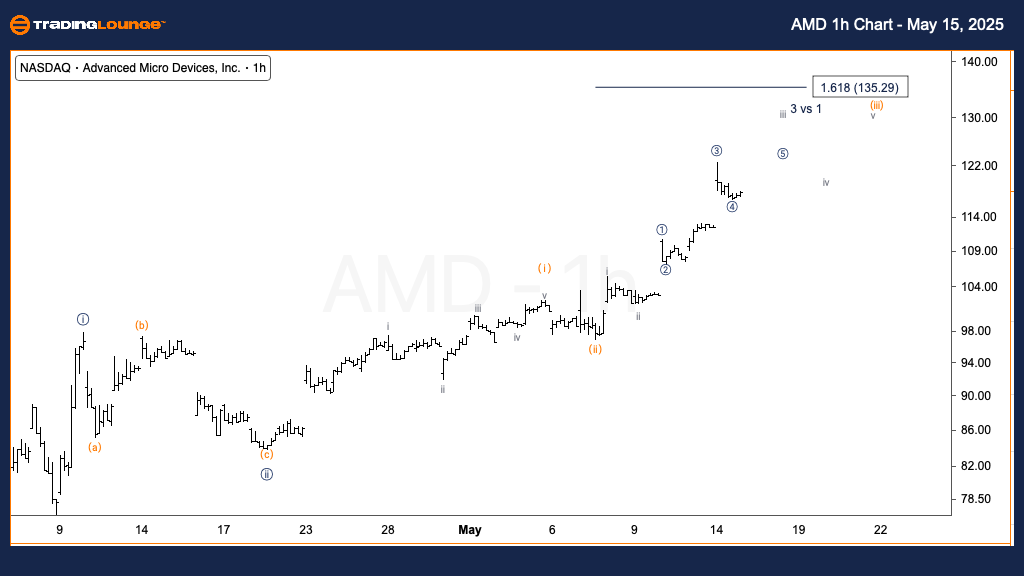
Advanced Micro Devices Inc. (AMD) – Tradinglounge 1H Chart
AMD Elliott Wave Technical Outlook
FUNCTION: Trend
MODE: Impulsive
STRUCTURE: Motive
POSITION: Wave iii of (iii)
DIRECTION: Upside momentum within wave (iii)
DETAILS:
In the 1-hour chart analysis, AMD exhibits a strong bullish impulse as it progresses within wave iii of (iii). The presence of nested third waves suggests increasing momentum and sustained buying pressure. Using Fibonacci extensions, the 1.618 level of wave (iii) relative to wave (i) projects a near-term resistance at around $135. This level serves as a critical price target for short-term traders.
This Elliott Wave forecast for AMD reflects a strong upward trend across both daily and intraday timeframes. Traders should monitor the $135 and $150 levels for potential market reactions.
Technical Analyst: Alessio Barretta
Source: Visit Tradinglounge.com and learn from the Experts. Join TradingLounge Here
Previous: SuperMicro Computers Inc. (SMCI) Elliott Wave Technical Analysis
VALUE Offer - Buy 1 Month & Get 3 Months!Click here
Access 7 Analysts Over 200 Markets Covered. Chat Room With Support