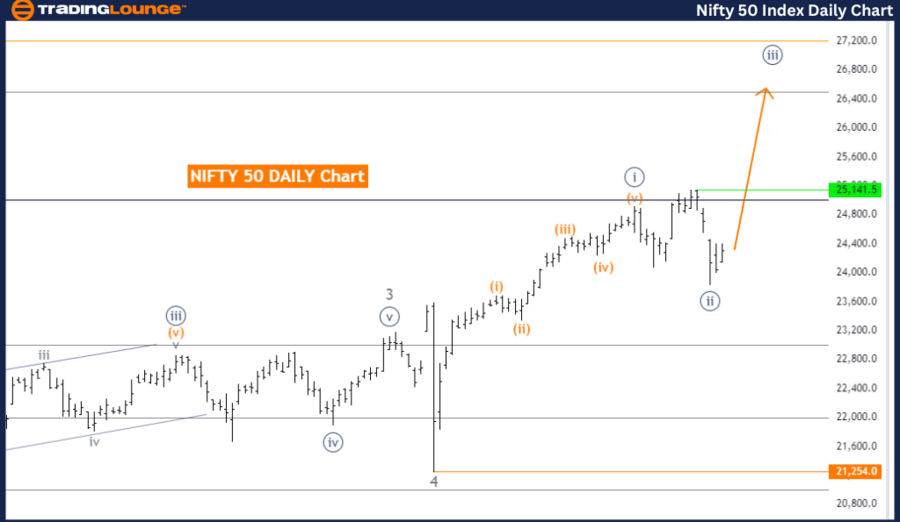
NIFTY 50 (India) Elliott Wave Analysis Trading Lounge Day Chart
NIFTY 50 (India) Elliott Wave Technical Analysis
Function: Trend
Mode: Impulsive
Structure: Navy Blue Wave 3
Position: Gray Wave 5
Direction Next Higher Degrees: Navy Blue Wave 3 (started)
Details: Navy Blue Wave 2 of 5 appears complete. Navy Blue Wave 3 is now active.
Wave Cancel Invalid Level: 21,254.0
The NIFTY 50 (India) Elliott Wave Analysis on the daily chart shows the market in a trend mode with an impulsive wave pattern. The focus is on Navy Blue Wave 3, indicating the trend's continuation.
Currently, the market is in Gray Wave 5, the final phase of this wave sequence. The direction for higher degrees remains Navy Blue Wave 3, suggesting the impulsive trend will persist.
The analysis indicates Navy Blue Wave 2 of 5 is complete, marking a crucial transition where the market moves from the corrective phase of Wave 2 to the more aggressive Navy Blue Wave 3. This phase is typically associated with strong market movements and increased momentum.
The wave cancel invalid level is set at 21,254.0. This level is critical for validating the current wave structure. If the NIFTY 50 index falls below this level, it would invalidate the current wave count, suggesting the progression from Navy Blue Wave 2 to Navy Blue Wave 3 may not occur as expected. This would require a reevaluation of the wave count and market outlook.
Summary: The NIFTY 50 (India) Elliott Wave Analysis on the daily chart indicates the market is in an impulsive trend phase, positioned in Gray Wave 5 within Navy Blue Wave 3. With Navy Blue Wave 2 of 5 complete, the market is progressing through Navy Blue Wave 3, characterized by strong upward momentum. The wave cancel invalid level at 21,254.0 is crucial for maintaining the wave structure's validity, with any breach requiring a reassessment of the market's direction.
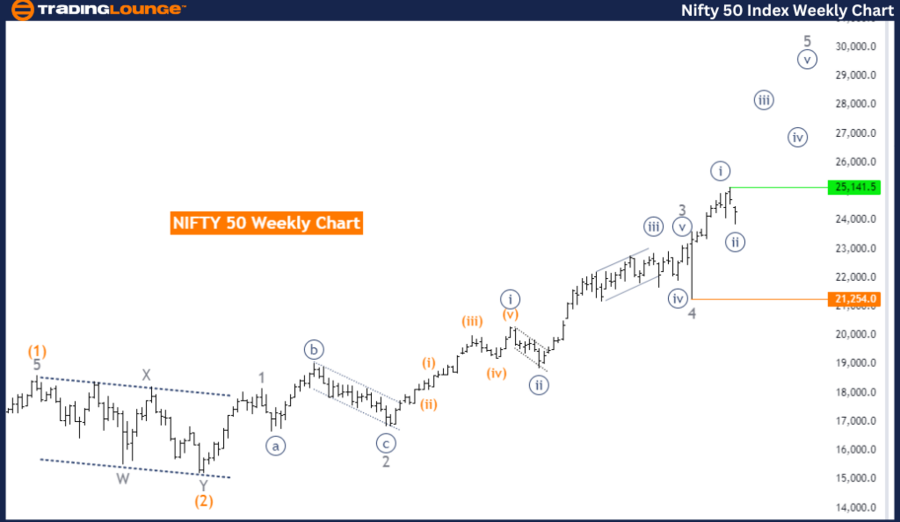
NIFTY 50 (India) Elliott Wave Analysis Trading Lounge Weekly Chart
NIFTY 50 (India) Elliott Wave Technical Analysis
Function: Trend
Mode: Impulsive
Structure: Navy Blue Wave 3
Position: Gray Wave 5
Direction Next Higher Degrees: Navy Blue Wave 3 (started)
Details: Navy Blue Wave 2 of 5 appears complete. Navy Blue Wave 3 is now active.
Wave Cancel Invalid Level: 21,254.0
The NIFTY 50 (India) Elliott Wave Analysis on the weekly chart indicates the market is in a trend mode, characterized by an impulsive wave pattern. The focus is on Navy Blue Wave 3, suggesting the trend's continuation.
Currently, the market is in Gray Wave 5, the final phase of this wave sequence. The direction for higher degrees remains Navy Blue Wave 3, indicating the impulsive trend will persist.
According to the analysis, Navy Blue Wave 2 of 5 is complete, marking a critical transition where the market moves from the corrective phase of Wave 2 to the more aggressive Navy Blue Wave 3. This phase typically involves strong market movements and increased momentum.
The wave cancel invalid level is set at 21,254.0. This level acts as a validation point for the current wave structure. If the NIFTY 50 index falls below this level, it would invalidate the current wave count, suggesting the progression from Navy Blue Wave 2 to Navy Blue Wave 3 may not occur as expected. This would necessitate a reevaluation of the wave count and market outlook.
Summary: The NIFTY 50 (India) Elliott Wave Analysis on the weekly chart shows the market is in an impulsive trend phase, positioned in Gray Wave 5 within Navy Blue Wave 3. With Navy Blue Wave 2 of 5 complete, the market is progressing through Navy Blue Wave 3, characterized by strong upward momentum. The wave cancel invalid level at 21,254.0 is crucial for maintaining the wave structure's validity, with any breach requiring a reassessment of the market's direction.
Technical Analyst: Malik Awais
Source: visit Tradinglounge.com and learn From the Experts Join TradingLounge Here
See previous: Shanghai Composite Elliott Wave Technical Analysis
Special Trial Offer - 0.76 Cents a Day for 3 Months! Click here
Access 7 Analysts Over 170 Markets Covered. Chat Room With Support