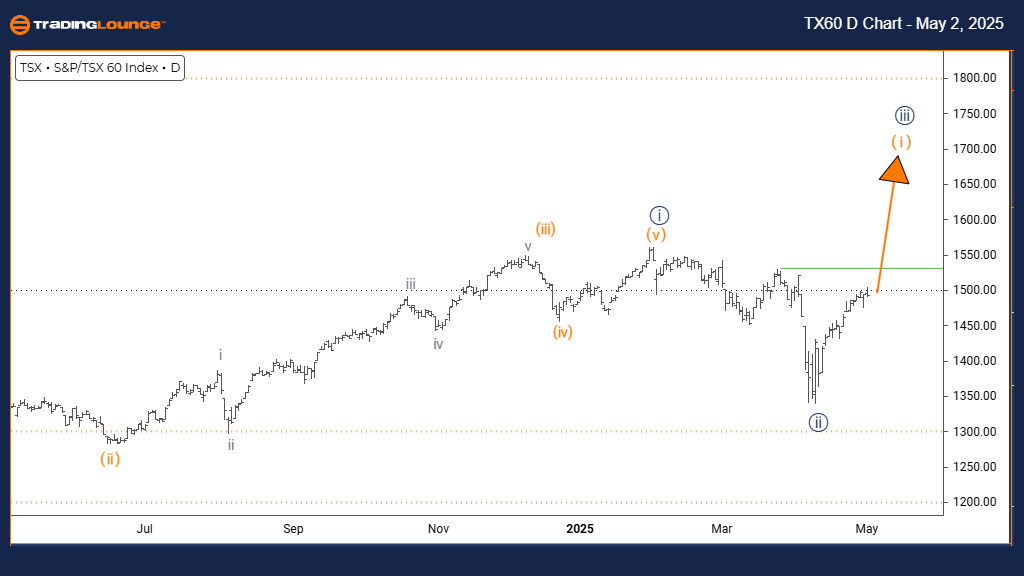
S&P/TSX 60 Elliott Wave Analysis | TradingLounge Day Chart
S&P/TSX 60 Elliott Wave Technical Analysis
FUNCTION: Bullish Trend
MODE: Impulsive
STRUCTURE: Orange wave 1
POSITION: Navy blue wave 3
DIRECTION NEXT LOWER DEGREES: Orange wave 2
Details:
The S&P/TSX 60 index daily Elliott Wave analysis highlights a strengthening bullish trend through an impulsive wave structure. Following the completion of navy blue wave 2, the development of orange wave 1 within navy blue wave 3 is now underway.
This current Elliott Wave count suggests that the S&P/TSX 60 is in the early stages of a new upward impulsive sequence, indicating a potential surge in bullish momentum. Orange wave 1 typically marks the initial phase of a rally, often building a foundation for stronger moves as confidence in the trend increases.
The completion of navy blue wave 2 has created a solid base, and as orange wave 1 matures, moderate but steady gains are expected. A corrective pullback into orange wave 2 will likely follow, offering a valuable opportunity for traders to join the upward trend before a powerful wave 3 rally commences.
Elliott Wave traders should closely monitor the development of orange wave 1, looking for typical bullish indicators such as rising volume and consistent higher closes. Although early impulsive waves often show gradual price advances, they set the stage for much stronger subsequent moves.
Overall, the transition into navy blue wave 3 signals the potential for sustained bullish momentum over the coming sessions. Tracking price action and technical indicators is critical for confirming wave progression and positioning effectively for the next major bullish phase.
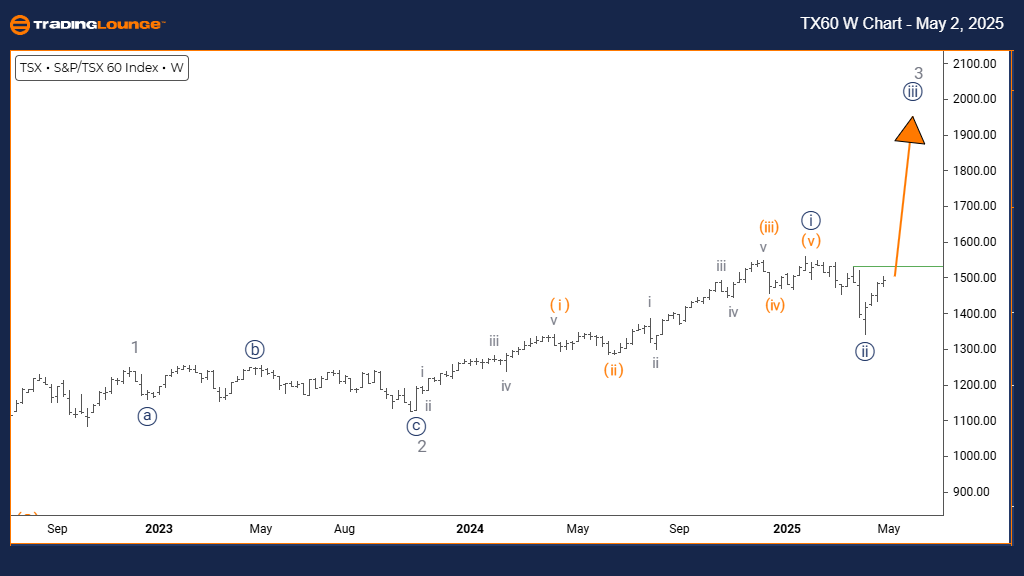
S&P/TSX 60 Elliott Wave Analysis | TradingLounge Weekly Chart
S&P/TSX 60 Elliott Wave Technical Analysis
FUNCTION: Bullish Trend
MODE: Impulsive
STRUCTURE: Navy blue wave 3
POSITION: Gray wave 3
DIRECTION NEXT HIGHER DEGREES: Navy blue wave 3 (in progress)
Details:
The S&P/TSX 60 weekly Elliott Wave analysis shows a strong and advancing bullish trend driven by an impulsive wave structure. With gray wave 2 completed, the market has entered navy blue wave 3 within the broader gray wave 3 structure, pointing to a critical phase of strong price advancement.
Navy blue wave 3 typically represents the most dynamic and powerful part of an Elliott Wave cycle, often delivering extended rallies with heightened momentum. With the wave 2 correction behind us, the S&P/TSX 60 is now poised for a robust rally that should outperform the earlier wave 1 move in both scale and strength.
The weekly timeframe underscores the significance of this movement, suggesting that a major bullish sequence is in progress. The transition into gray wave 3 at a higher degree supports expectations of sustained upward price action across longer horizons.
Traders should focus on identifying classic wave 3 characteristics, such as strong volume, aggressive price gains, and limited pullbacks. Staying aligned with the trend during this phase is critical, as Elliott Wave theory highlights wave 3 as the most profitable period for trend-following strategies.
Following the completion of navy blue wave 3, a corrective phase into navy blue wave 4 is expected, which will present another strategic entry opportunity within the ongoing bullish trend. Until then, maintaining a bullish bias and tracking momentum indicators will be key to maximizing gains during this impulsive rally.
The current setup provides ideal conditions for swing trading and trend-following strategies, as wave 3 generally offers the clearest and strongest market movement within an Elliott Wave cycle.
Technical Analyst: Malik Awais
Source: Visit Tradinglounge.com and learn from the Experts. Join TradingLounge Here
Previous: DAX (Germany) Elliott Wave Technical Analysis
VALUE Offer - Buy 1 Month & Get 3 Months!Click here
Access 7 Analysts Over 200 Markets Covered. Chat Room With Support