JAMES HARDIE INDUSTRIES PLC (JHX) Elliott Wave Technical Analysis
Market Outlook
Our Elliott Wave analysis provides an updated forecast for the Australian Stock Exchange (ASX), with a specific focus on JAMES HARDIE INDUSTRIES PLC (JHX). The ASX:JHX shares are anticipated to extend their decline in the medium term. Given the prevailing risk factors, long strategies should be approached cautiously. This analysis examines the potential trend movements and key price levels, integrating both technical and market-driven insights.
JAMES HARDIE INDUSTRIES PLC (JHX) Elliott Wave Technical Analysis
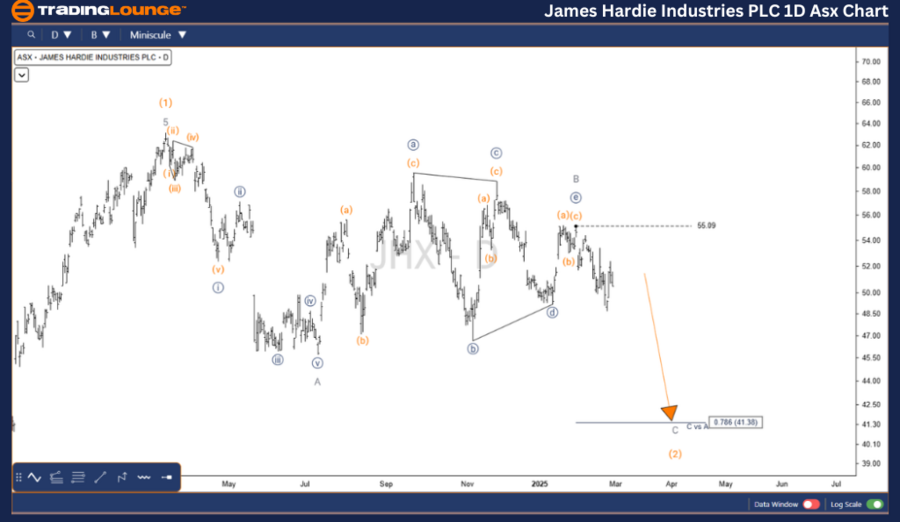
1D Chart (Semilog Scale) Analysis
Function: Major trend (Intermediate degree, Orange)
Mode: Motive
Structure: Impulse
Position: Wave C - Grey of Wave (2) - Orange
Details:
The Wave (2) - Orange remains incomplete, forming a Zigzag pattern. The recent sideways price action suggests a Triangle structure, labeled as Wave B - Grey, has concluded. This signals that Wave C - Grey is likely to push lower, breaching the 49.16 USD support level to confirm the bearish outlook.
- Invalidation Point: 55.09
- Key Level: 49.16
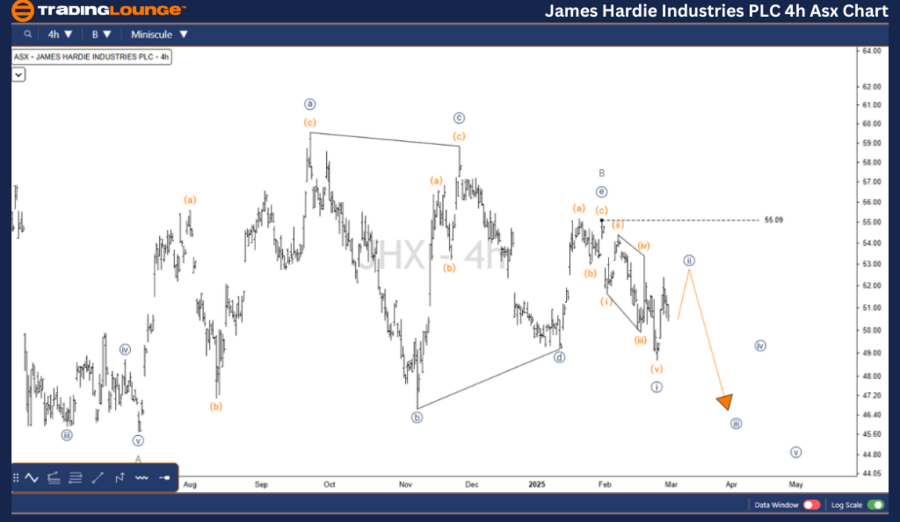
JAMES HARDIE INDUSTRIES PLC (JHX) Elliott Wave Technical Analysis
4-Hour Chart Analysis
Function: Major trend (Intermediate degree, Orange)
Mode: Motive
Structure: Impulse
Position: Wave ((ii)) - Navy of Wave C - Grey of Wave (2) - Orange
Details:
A closer inspection of the ((e)) - Navy wave within the B - Grey wave shows a three-wave Zigzag pattern, which recently concluded at 55.09 USD. This wave structure aligns with the bearish forecast, increasing the probability of continued price weakness.
- Invalidation Point: 55.09
- Key Level: 49.16
Technical Analyst: Hua (Shane) Cuong, CEWA-M (Master’s Designation).
Source: visit Tradinglounge.com and learn From the Experts Join TradingLounge Here
See Previous: NEWMONT CORPORATION (NEM) Elliott Wave Technical Analysis
VALUE Offer - Buy 1 Month & Get 3 Months!Click here
Access 7 Analysts Over 200 Markets Covered. Chat Room With Support
Conclusion
This Elliott Wave analysis of JAMES HARDIE INDUSTRIES PLC (JHX) identifies critical price levels and provides insights into broader market trends. Our wave count validation enhances the forecast's accuracy, allowing traders to make well-informed decisions. By merging technical analysis with market data, this report delivers a professional outlook on potential market movements.