27Feb

NEWMONT CORPORATION (ASX:NEM) Elliott Wave Technical Analysis – Stock Price Prediction, Support & Resistance Levels for Investors

NEWMONT CORPORATION (NEM) – Elliott Wave Technical Analysis

TradingLounge Elliott Wave Forecast for ASX:NEM

Overview

This Elliott Wave analysis focuses on NEWMONT CORPORATION (ASX:NEM), highlighting potential bullish price movements and key levels to watch. Our wave count suggests an upside opportunity, making it essential for traders to monitor critical resistance and support areas for trend validation.


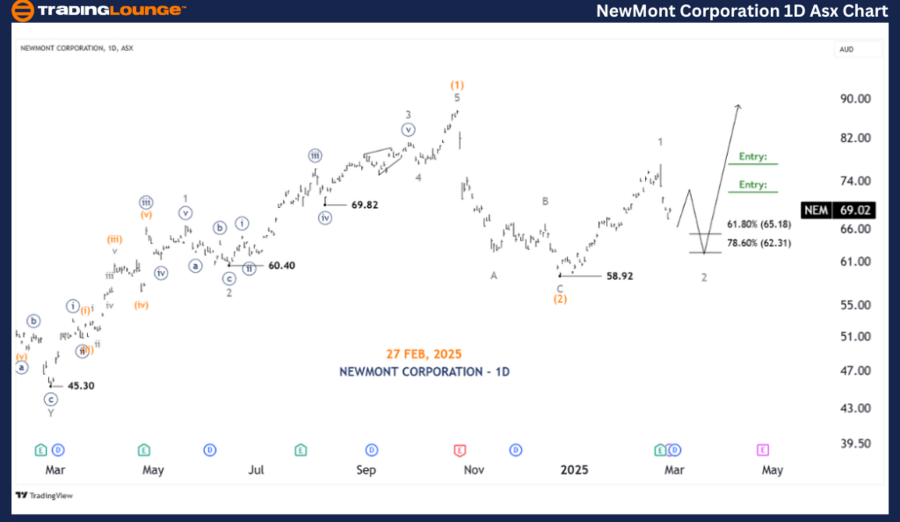
NEWMONT CORPORATION (NEM) – Elliott Wave Technical Analysis (1D Chart - Semilog Scale)

Function: Major trend (Intermediate degree, orange)

Mode: Motive

Structure: Impulse

Position: Wave 2 - grey of Wave (3) - orange

Analysis Details

  • Wave (2) - orange appears to have completed a Zigzag correction around 58.92, signaling a potential bullish move into Wave (3) - orange.
  • If confirmed, Wave (3) - orange is likely extending into wave 1,2 - grey.
  • Upon the completion of Wave 2 - grey, confirmation of renewed bullish momentum into Wave 3 - grey will be expected.

Key Levels

  • Invalidation Point: 58.92 (If price drops below this level, the wave count is invalidated.)

newmont-corporation-...


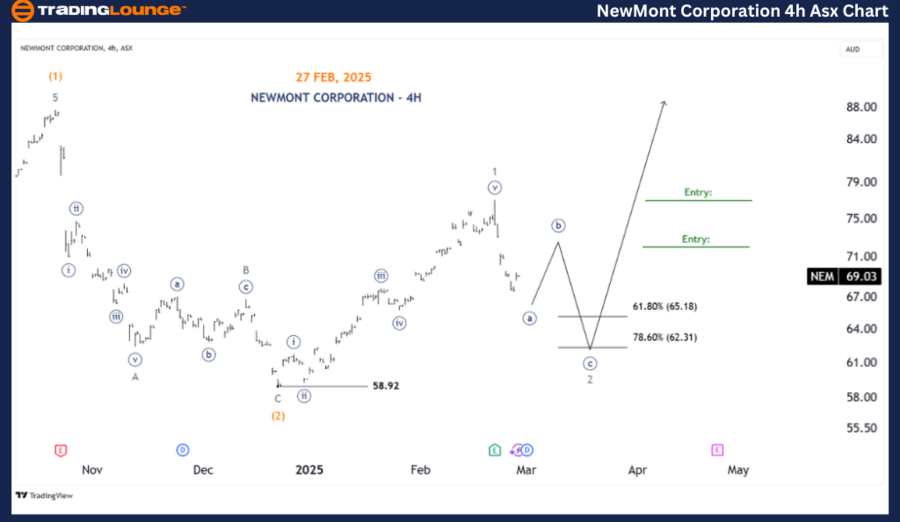
NEWMONT CORPORATION (NEM) – Elliott Wave Technical Analysis (4-Hour Chart)

Function: Major trend (Minor degree, grey)

Mode: Motive

Structure: Impulse

Position: Wave ((a)) - navy of Wave 2 - grey

Analysis Details

  • Wave 1 - grey has completed at 59.92, and the price is currently forming Wave 2 - grey.
  • This corrective move is developing into a Zigzag pattern labeled ((a))((b))((c)) - navy, with a projected decline toward 65.18 - 62.31.
  • Once Wave 2 - grey is complete, potential long entry points could emerge, particularly at the completion of Wave ((b)) - navy, leading into Wave 3 - grey.
  • However, if the price drops below 62.31, traders should exercise caution, as this would weaken the forecast and require a reassessment of the market structure.

Key Levels

  • Invalidation Point: 58.92 (A break below this level signals a need for a new wave count.)

Technical Analyst: Hua (Shane) Cuong, CEWA-M (Master’s Designation).

Source: visit Tradinglounge.com and learn From the Experts Join TradingLounge Here 

See Previous: WESTPAC BANKING CORPORATION – WBC Elliott Wave Technical Analysis

VALUE Offer - Buy 1 Month & Get 3 Months!Click here

Access 7 Analysts Over 200 Markets Covered. Chat Room With Support

newmont-corporation-...


Conclusion

Our Elliott Wave analysis of NEWMONT CORPORATION (NEM) on ASX highlights potential bullish price movements while identifying key support and resistance zones. The provided wave count and price projections help traders refine their strategies with a data-driven approach. By tracking these critical levels, traders can make informed decisions, leveraging Elliott Wave principles to maximize trading opportunities.

Related

Explore the ASX Trading Success: REECE LIMITED – REH Stock Analysis & Elliott Wave Technical Forecast

Explore the ASX Trading Success: REECE LIMITED – REH Stock Analysis & Elliott Wave Technical Forecast

Explore the potential future movements of Reece Limited (REH) on the ASX through detailed Elliott Wa...

Read More >
NASDAQ Stock Market Update: Key Insights on AAPL, TSLA, AMZN, and More as Earnings Week Approaches

NASDAQ Stock Market Update: Key Insights on AAPL, TSLA, AMZN, and More as Earnings Week Approaches

The text provides an Elliott Wave analysis of the NASDAQ stock market, focusing on major indices lik...

Read More >
JP Morgan Chase & Co.(JPM:NYSE) Elliott Wave Technical Analysis Chart 13 October 23

JP Morgan Chase & Co.(JPM:NYSE) Elliott Wave Technical Analysis Chart 13 October 23

Trading Lounge Elliott Wave Technical Analysis Chart of JPM Stock for 13 October 23.

Read More >
Tech Stock Forecast: AAPL, NVDA, AMZN Lead While TSLA, MSFT, GOOGL Lag...

Tech Stock Forecast: AAPL, NVDA, AMZN Lead While TSLA, MSFT, GOOGL Lag...

The Elliott Wave analysis indicates an upward movement (Wave (ii) of iii)) for the SP500 and NASDAQ ...

Read More >
AAVE / U.S. dollar(AAVEUSD) Elliott Wave Technical Analysis 18 January 24

AAVE / U.S. dollar(AAVEUSD) Elliott Wave Technical Analysis 18 January 24

AAVE/U.S. dollar(AAVEUSD) Elliott Wave Technical Analysis dated 18 January 24, Our AAVE/U.S. dollar(...

Read More >
Indian Stock Market Update on OIL & NATURAL Gas Co. Stock Analysis: ONGC Elliott Wave Technical Analysis & Price Prediction

Indian Stock Market Update on OIL & NATURAL Gas Co. Stock Analysis: ONGC Elliott Wave Technical Analysis & Price Prediction

Discover comprehensive ONGC stock analysis featuring Elliott Wave forecasts, technical analysis, and...

Read More >

Buy 1 Month

Get 3 Months!

Special Offer:

Trade Recommendations

Unleash the power of deversified trading with our comprehensive portfolio, covering:

  • Stock Trades
  • Crypto Trades
  • Forex Trades
  • Commodity Trades
Elliott Wave Analysis

Gain a competive edge with expert insights in to:

  • Global Indices
  • US Stocks & ASX Stocks
  • Forex & Crypto
  • Commodities
Top-Notch Trading Tools

Equip yourself with the tools of success:

  • Social Chat
  • Elliott Wave Algorithm
  • Screener
  • TradingLevels
  • Trading Game
7 Elliott Wave Analysts

Stay ahead of the market with daily charts and insightful videos
-Your secret to strategic trading!

JOIN HERE


Welcome to TradingLounge (ASIC A.R.No. 321187), specialists in trades, trading education and technical analysis, covering stocks, indices, commodities, forex and cryptocurrencies.

When you join TradingLounge you have access to everything we offer, including trade tools, educational content and a social platform to chat with like-minded investors.

Read more

@Copyright 2024 by tradinglounge.com

Contact Us

Australian no: 02 4787 6020

International no: +61 (2) 47876020

Pay with:

Find us on