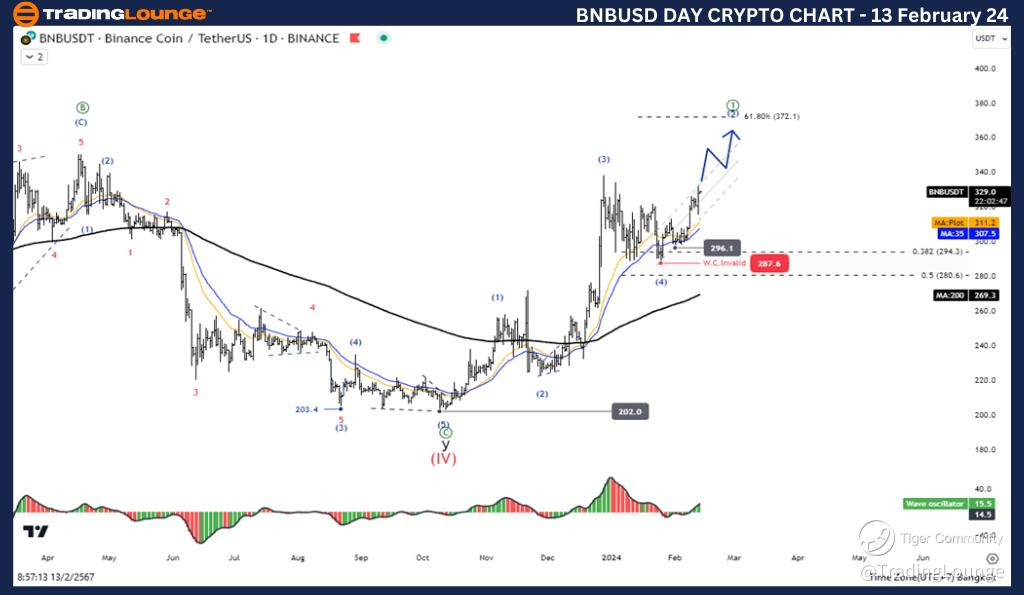
Elliott Wave Analysis TradingLounge Daily Chart, 13 February 24,
TradingLounge BNBUSD Elliott Wave Technical Analysis
In the world of cryptocurrency trading, Elliott Wave Analysis stands out as a powerful tool for predicting market movements. Today, let's delve into the Elliott Wave Technical Analysis for Binance Coin/U.S. Dollar (BNBUSD) on both the daily and 4-hour charts.
Daily Chart Analysis:
Functioning as a counter-trend within a corrective mode, BNBUSD exhibits a zigzag structure currently positioned at Wave 4. According to Elliott Wave principles, the direction of the next higher degree indicates a potential impulsive Wave ((1)). A critical level to watch for wave cancellation lies at 202.8.
In terms of trading strategy, there's anticipation for another surge in Wave (5) following the completion of Wave (4), with a price target set at the 372.1 level. This target aligns with the 0.618 Fibonacci retracement level of the length from Wave (1) to Wave (3), suggesting that Binance remains in an upward trend trajectory with room for further price appreciation.
Technical indicators reinforce this outlook, with the price comfortably above the MA200, signaling an uptrend, and Wave Oscillators indicating bullish momentum.

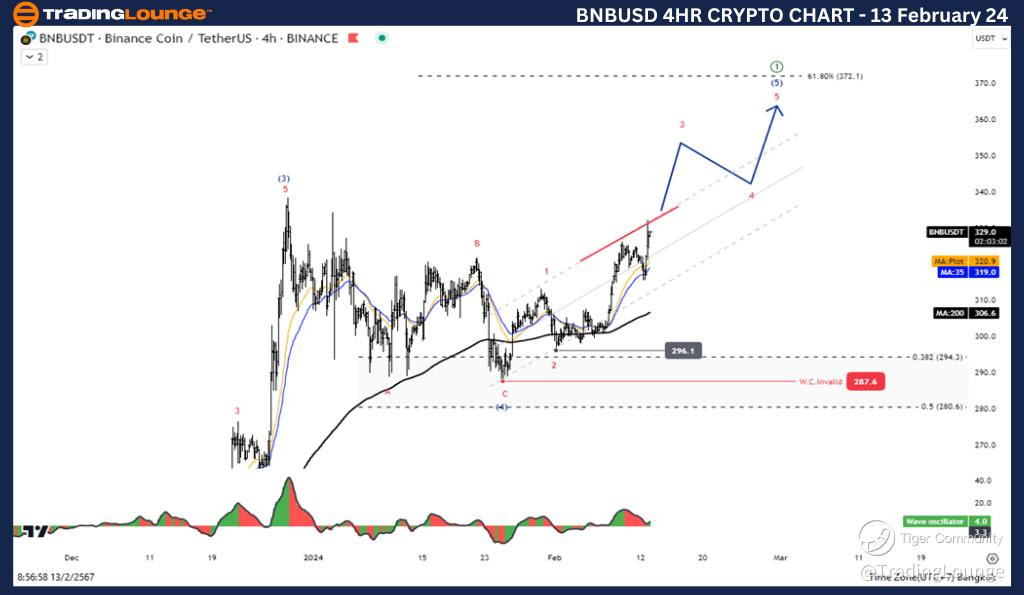
Elliott Wave Analysis TradingLounge 4Hr Chart, 13 February 24,
BNBUSD Elliott Wave Technical Analysis
4-Hour Chart Analysis:
Similarly, on the 4-hour chart, BNBUSD displays characteristics of a counter-trend corrective zigzag pattern at Wave 4. The analysis echoes the sentiment of a potential resurgence in price with Wave 5 likely to unfold.
Reiterating the trading strategy, the projection targets the 372.1 level, reflective of the 0.618 Fibonacci extension from Wave (1) to Wave (3). This reinforces the overarching uptrend narrative for Binance Coin, hinting at further upward price movement.
Once again, technical indicators validate this perspective, with the price maintaining its position above the MA200, indicating a sustained uptrend, while Wave Oscillators exhibit bullish momentum.
TradingLounge Analyst: Kittiampon Somboonsod, CEWA
Source: visit Tradinglounge.com and learn From the Experts Join TradingLounge Here
See Previous: VeChain / U.S. dollar(VETUSD)

Conclusion:
In summary, Elliott Wave Analysis provides valuable insights into the potential trajectory of Binance Coin against the U.S. Dollar. Both the daily and 4-hour charts suggest a corrective phase at Wave 4, poised to transition into Wave 5, indicative of further upward movement. With technical indicators aligning with this bullish outlook, traders may find opportunities to capitalize on the anticipated price appreciation of BNBUSD.
Stay tuned for further updates as we navigate the dynamic landscape of cryptocurrency trading with Elliott Wave Analysis.