15Aug

Navigate the Upcoming Corrections and Future Waves in the Cardano Crypto Market: ADAUSD Elliott Wave Technical Analysis

ADAUSD Elliott Wave Analysis - TradingLounge Daily Chart

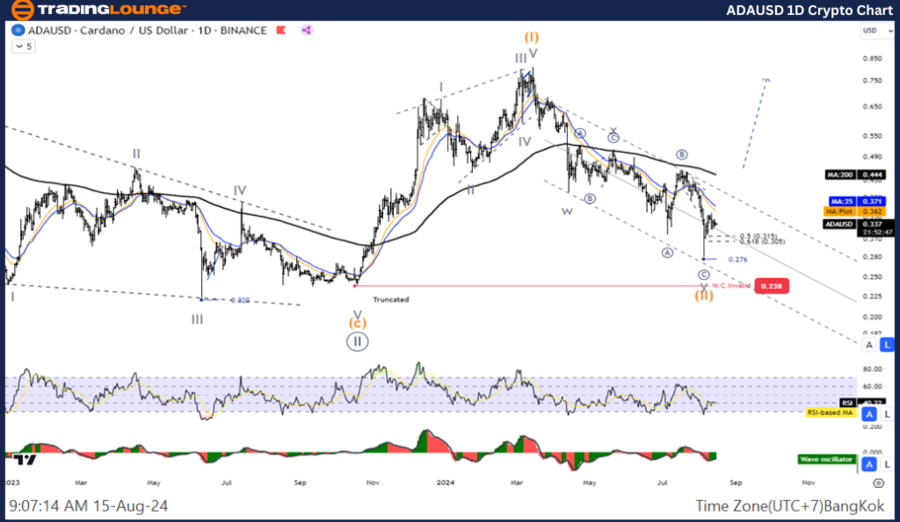
Cardano/ U.S. Dollar (ADAUSD) - Daily Chart Analysis

ADAUSD Elliott Wave Technical Analysis

Function: Counter Trend

Mode: Corrective

Structure: Double Corrective

Position: Wave Y

Direction Next Higher Degrees: Wave (II)

Wave Cancel Invalid Level: Not specified

Details: The decline in Wave Y is likely nearing completion, with a potential re-entry into the uptrend.

Cardano/ U.S. Dollar (ADAUSD) - Trading Strategy

Cardano's current outlook suggests that the Wave 1 rally may be concluding. The price is expected to undergo a correction in Wave 2, potentially testing the 61.8% retracement level (0.365) of Wave 1 before resuming an upward movement in Wave 3. Traders should consider waiting for the correction to complete as a strategic entry point to rejoin the uptrend.

Cardano/ U.S. Dollar (ADAUSD) - Technical Indicators

  • MA200: The price is trading below the 200-day moving average, indicating a bearish trend.

  • Wave Oscillator: Bearish momentum is observed.

ADAUSD-1D-Crypto-Cha...


ADAUSD Elliott Wave Analysis - TradingLounge H4 Chart

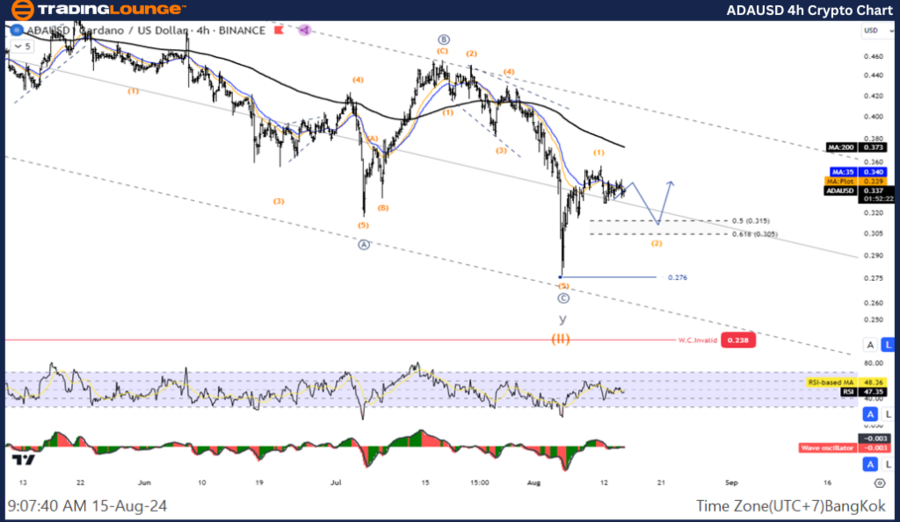
Cardano/ U.S. Dollar (ADAUSD) - 4-Hour Chart Analysis

ADAUSD Elliott Wave Technical Analysis

Function: Counter Trend

Mode: Corrective

Structure: Zigzag

Position: Wave B

Direction Next Higher Degrees: Wave (2) of Impulse

Wave Cancel Invalid Level: Not specified

Details: Wave (2) is expected to retrace to the 61.8% level of Wave (1).

Cardano/ U.S. Dollar (ADAUSD) - Trading Strategy

Similar to the daily outlook, Cardano’s price is anticipated to complete its Wave 1 rally soon, entering a corrective phase in Wave 2. This correction is likely to test the 61.8% retracement level (0.365) before the price rises again in Wave 3. Traders should monitor the correction for an optimal point to enter the market in alignment with the larger uptrend.

Cardano/ U.S. Dollar (ADAUSD) - Technical Indicators

  • MA200: The price remains below the 200-period moving average, reinforcing the downtrend.

  • Wave Oscillator: Continues to indicate bearish momentum.

Technical Analyst:  Kittiampon Somboonsod

Source: visit Tradinglounge.com and learn From the Experts Join TradingLounge Here 

See Previous: ChainLink/U.S. Dollar (LINKUSD) Elliott Wave Technical Analysis

Special Trial Offer - 0.76 Cents a Day for 3 Months! Click here

Access 7 Analysts Over 170 Markets Covered. Chat Room With Support

ADAUSD-4H-Crypto-Cha...

Related

IBEX 35 Market Analysis: IBEX 35 (Spain) Index Elliott Wave Technical Analysis with Daily and Weekly Charts

IBEX 35 Market Analysis: IBEX 35 (Spain) Index Elliott Wave Technical Analysis with Daily and Weekly Charts

The IBEX 35 Elliott Wave analysis provides a detailed look at the market's current trends on bot...

Read More >
Expert Elliott Wave Analysis on Global Indices: S&P 500, NASDAQ 100, DAX 40, FTSE 100 & ASX 20

Expert Elliott Wave Analysis on Global Indices: S&P 500, NASDAQ 100, DAX 40, FTSE 100 & ASX 20

Gain comprehensive insights with our expert Elliott Wave analysis covering major global indices. Sta...

Read More >
Elliott Wave Analysis for NASDAQ Tech Stocks: Identifying Potential Bottoms and Long Trade Setups

Elliott Wave Analysis for NASDAQ Tech Stocks: Identifying Potential Bottoms and Long Trade Setups

The SP500 and NASDAQ have shown signs of a possible bottom following a recent correction. NVDA, amon...

Read More >
ASX FPH Stock Analysis: Fisher & Paykel Healthcare Elliott Wave Forecast, Wave 4 Triangle Pattern, and Price Prediction Insights

ASX FPH Stock Analysis: Fisher & Paykel Healthcare Elliott Wave Forecast, Wave 4 Triangle Pattern, and Price Prediction Insights

Elliott Wave analysis for ASX: FPH (Fisher & Paykel Healthcare Corporation Limited). Our technical a...

Read More >
Elliott Wave Technical Analysis and Trading Strategies: S&P 500, NASDAQ 100, DAX 40, FTSE 100, ASX 200

Elliott Wave Technical Analysis and Trading Strategies: S&P 500, NASDAQ 100, DAX 40, FTSE 100, ASX 200

he document provides an in-depth Elliott Wave analysis of major global indices, including the S&P 50...

Read More >
Providing Forecasts for the British Pound to U.S. Dollar Currency Pair: GBPUSD Forex Elliott Wave Technical Analysis

Providing Forecasts for the British Pound to U.S. Dollar Currency Pair: GBPUSD Forex Elliott Wave Technical Analysis

Our detailed GBPUSD Elliott Wave analysis covers daily and 4-hour chart evaluations, providing forec...

Read More >

Buy 1 Month

Get 3 Months!

Special Offer:

Trade Recommendations

Unleash the power of deversified trading with our comprehensive portfolio, covering:

  • Stock Trades
  • Crypto Trades
  • Forex Trades
  • Commodity Trades
Elliott Wave Analysis

Gain a competive edge with expert insights in to:

  • Global Indices
  • US Stocks & ASX Stocks
  • Forex & Crypto
  • Commodities
Top-Notch Trading Tools

Equip yourself with the tools of success:

  • Social Chat
  • Elliott Wave Algorithm
  • Screener
  • TradingLevels
  • Trading Game
7 Elliott Wave Analysts

Stay ahead of the market with daily charts and insightful videos
-Your secret to strategic trading!

JOIN HERE


Welcome to TradingLounge (ASIC A.R.No. 321187), specialists in trades, trading education and technical analysis, covering stocks, indices, commodities, forex and cryptocurrencies.

When you join TradingLounge you have access to everything we offer, including trade tools, educational content and a social platform to chat with like-minded investors.

Read more

@Copyright 2024 by tradinglounge.com

Contact Us

Australian no: 02 4787 6020

International no: +61 (2) 47876020

Pay with:

Find us on