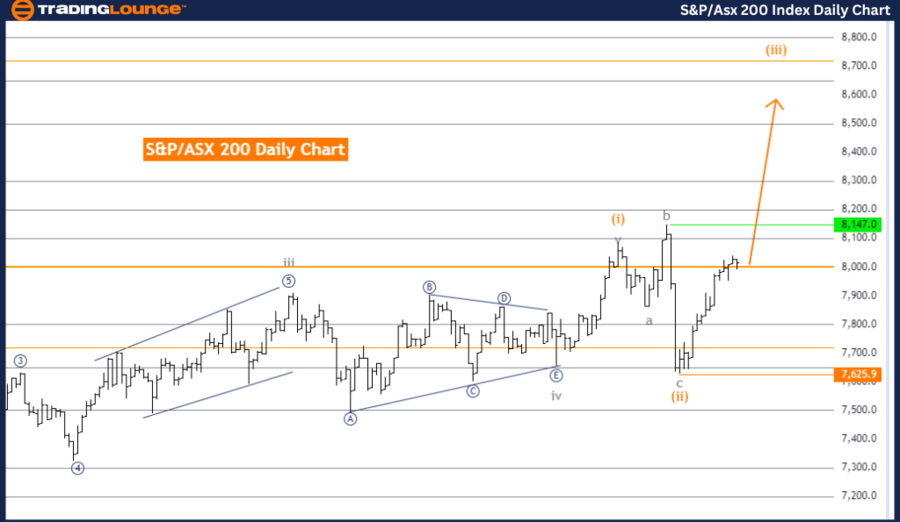
S&P/ASX 200 Elliott Wave Analysis Trading Lounge Day Chart
S&P/ASX 200 Index Day Chart Analysis
S&P/ASX 200 Elliott Wave Technical Analysis
FUNCTION: Trend
MODE: Impulsive
STRUCTURE: Orange wave 3
POSITION: Navy Blue Wave 3
DIRECTION NEXT LOWER DEGREES: Orange wave 4
DETAILS: Orange wave 2 appears to be completed. Now, orange wave 3 of navy blue wave 3 is in play.
Wave Cancel invalid level: 7,625.9
The S&P/ASX 200 is currently demonstrating a robust trend based on Elliott Wave analysis on the daily chart. The market is in an impulsive mode, reflecting a clear and strong upward momentum. The primary wave structure being analyzed is orange wave 3, which is a significant phase in the Elliott Wave cycle, often marked by considerable price movement and momentum.
The current position of the market falls within navy blue wave 3, which is an integral part of the broader orange wave 3 structure. This indicates that the market is experiencing a powerful upward trend, as wave 3 in Elliott Wave theory is typically one of the most extended and dynamic phases, propelling the market higher. The completion of orange wave 2 suggests the end of the corrective phase, leading to the initiation of the next impulsive phase, specifically orange wave 3.
As orange wave 3 of navy blue wave 3 unfolds, the market is expected to sustain its upward momentum. This wave is crucial as it often signifies the most vigorous part of the trend, potentially leading to further market gains. The analysis further supports this view, as the direction of the next lower degrees aligns with the ongoing movement of orange wave 3, reinforcing the likelihood of continued upward momentum.
A key level to monitor is 7,625.9, identified as the wave cancel invalid level. If the market drops below this threshold, the current wave count would be invalidated, suggesting that the expected wave structure is no longer applicable. This level is crucial for confirming the validity of the ongoing Elliott Wave analysis.
In conclusion, the S&P/ASX 200 is in a strong upward trend, with orange wave 3 developing within the broader navy blue wave 3 structure. The completion of orange wave 2 indicates further upward movement, with 7,625.9 serving as a critical level to watch for the continuation of this wave structure.
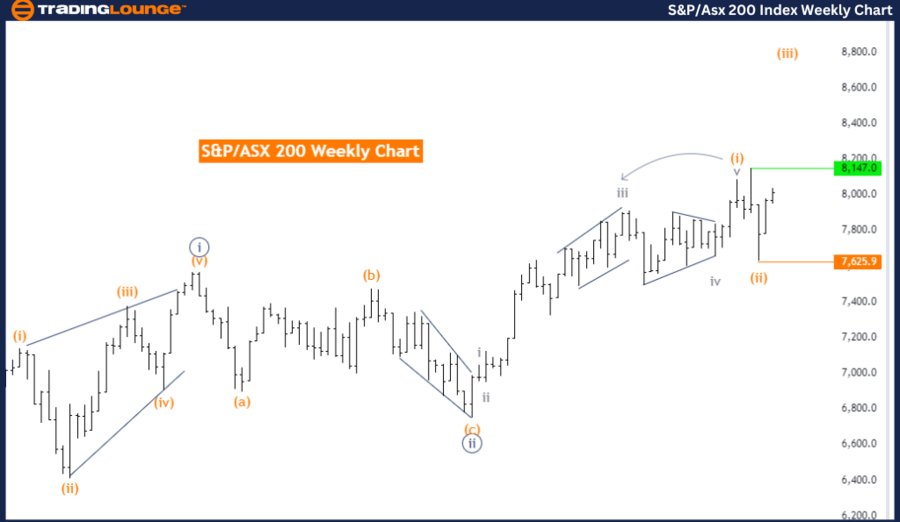
S&P/ASX 200 Elliott Wave Analysis Trading Lounge Weekly Chart
S&P/ASX 200 Index Weekly Chart Analysis
S&P/ASX 200 Index Technical Analysis
FUNCTION: Trend
MODE: Impulsive
STRUCTURE: Orange wave 3
POSITION: Navy Blue Wave 3
DIRECTION NEXT LOWER DEGREES: Orange wave 4
DETAILS: Orange wave 2 appears to be completed. Now, orange wave 3 of navy blue wave 3 is in play. Wave Cancel invalid level: 7,625.9
The S&P/ASX 200 is exhibiting a strong upward trend according to Elliott Wave analysis on the weekly chart. The analysis indicates that the market is in an impulsive mode, suggesting a clear and decisive bullish movement with strong momentum driving prices higher. The primary wave structure in focus is orange wave 3, a pivotal phase in the Elliott Wave sequence, typically associated with significant and sustained upward price movements.
Currently, the market is positioned within navy blue wave 3, part of the larger orange wave 3. This suggests that the market is in a particularly strong phase of its upward trend, as wave 3s are often the most extended and powerful waves in the Elliott Wave structure. The analysis points out that orange wave 2 has been completed, indicating that any prior corrective movement has ended, and the market has now resumed its upward trend with the commencement of orange wave 3 within navy blue wave 3.
The direction of the next lower degrees aligns with the ongoing orange wave 3, suggesting continued bullish momentum. This phase is typically marked by strong and sustained price increases as the trend accelerates and investor confidence builds.
A critical level to watch is 7,625.9, identified as the wave cancel invalid level. Should the market fall below this level, it would invalidate the current wave count and suggest a potential shift in market direction. This level is vital for confirming the ongoing bullish trend.
In summary, the S&P/ASX 200 is experiencing a strong upward trend, with orange wave 3 currently unfolding within the broader navy blue wave 3. The completion of orange wave 2 signals a phase of strong upward movement, with 7,625.9 being a key level to monitor for the continuation of this trend.
Technical Analyst: Malik Awais
Source: visit Tradinglounge.com and learn From the Experts Join TradingLounge Here
See previous: CAC 40 (France) Elliott Wave Technical Analysis
Special Trial Offer - 0.76 Cents a Day for 3 Months! Click here
Access 7 Analysts Over 200 Markets Covered. Chat Room With Support