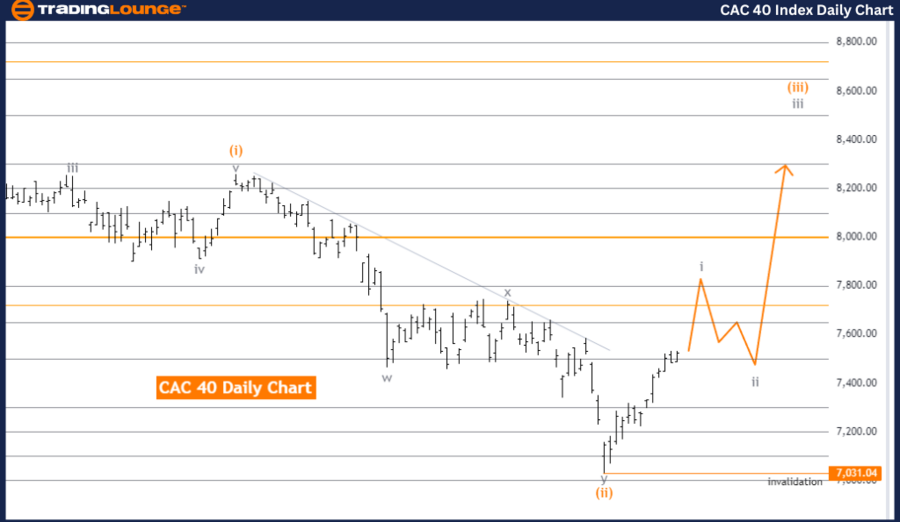
CAC 40 (France) Elliott Wave Analysis Trading Lounge Day Chart
CAC 40 (France) Day Chart Technical Analysis
CAC 40 (France) Elliott Wave Technical Analysis
- Function: Trend
- Mode: Impulsive
- Structure: Gray Wave 1
- Position: Orange Wave 3
- Next Lower Degree Direction: Gray Wave 2
- Details: Orange Wave 2 is complete; currently, Gray Wave 1 of Orange Wave 3 is unfolding.
- Wave Cancel Invalid Level: 7,031.04
The CAC 40 index in France is currently in a trending phase according to Elliott Wave analysis. The market is exhibiting impulsive characteristics, signifying a strong directional movement consistent with the prevailing trend. The primary structure under scrutiny is Gray Wave 1, indicating the beginning of a new impulsive wave sequence.
The index is now positioned within Orange Wave 3, which follows the completion of Orange Wave 2. This suggests a significant upward movement is underway, as Wave 3 is typically the most powerful and extended in an impulsive sequence. The ongoing development of Gray Wave 1 within Orange Wave 3 supports this upward momentum.
The analysis anticipates the emergence of Gray Wave 2, a corrective wave, after the current impulsive phase concludes. This wave is expected to provide a temporary retracement within the broader upward trend. However, the immediate focus remains on the completion of the ongoing impulsive phase.
A critical level to monitor is 7,031.04, designated as the wave cancel invalid level. Should the market price exceed this level, it would invalidate the current Elliott Wave count, indicating that the expected wave structure may not unfold as projected. This level is crucial for maintaining the validity of the current wave analysis.
In summary, the CAC 40 is in an impulsive trend phase, with Gray Wave 1 of Orange Wave 3 currently in progress. The completion of Orange Wave 2 signals a continuation of the upward movement, with Gray Wave 2 anticipated to follow. The 7,031.04 level is pivotal in confirming the integrity of the current Elliott Wave structure.
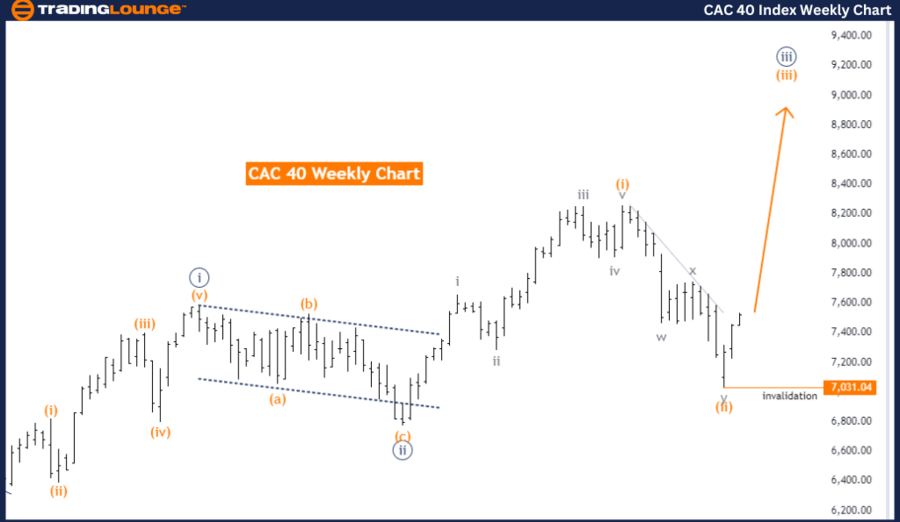
CAC 40 (France) Elliott Wave Analysis Trading Lounge Weekly Chart
CAC 40 (France) Elliott Wave Technical Analysis
- Function: Trend
- Mode: Impulsive
- Structure: Orange Wave 3
- Position: Navy Blue Wave 3
- Next Higher Degree Direction: Orange Wave 3 (Started)
- Details: Orange Wave 2 is complete; Orange Wave 3 is currently unfolding.
- Wave Cancel Invalid Level: 7,031.04
The CAC 40 index in France is demonstrating a strong trend, as revealed by Elliott Wave analysis on the weekly chart. The analysis indicates that the market is in an impulsive mode, suggesting a decisive and potent movement in the direction of the dominant trend. The primary focus is on Orange Wave 3, a crucial phase in an impulsive sequence that typically features substantial market advances.
Currently, the index is situated within Navy Blue Wave 3, which is a component of the broader Orange Wave 3 structure. This positioning implies that the market is experiencing robust upward momentum, as Wave 3 is generally the most dynamic and extended in the Elliott Wave sequence. The completion of Orange Wave 2 marks the end of a corrective phase, transitioning the market into the next impulsive stage, Orange Wave 3.
The direction of higher-degree waves continues to align with the initiation of Orange Wave 3, further supporting the prospect of continued upward movement in the market. The analysis confirms that Orange Wave 3 is active and suggests that the market is likely to achieve further gains as this wave progresses.
A key level to watch is 7,031.04, identified as the wave cancel invalid level. If the market price drops below this level, it would invalidate the current wave structure, indicating that the projected wave count is no longer applicable. This level is vital for verifying the accuracy of the ongoing Elliott Wave analysis.
In conclusion, the CAC 40 is in a strong upward trend, with Orange Wave 3 currently developing within Navy Blue Wave 3. The completion of Orange Wave 2 indicates that the market is poised for further advances, with 7,031.04 as a critical level to validate the current wave structure's accuracy.
Technical Analyst: Malik Awais
Source: visit Tradinglounge.com and learn From the Experts Join TradingLounge Here
See previous: NIFTY 50 index Elliott Wave Technical Analysis
Special Trial Offer - 0.76 Cents a Day for 3 Months! Click here
Access 7 Analysts Over 200 Markets Covered. Chat Room With Support