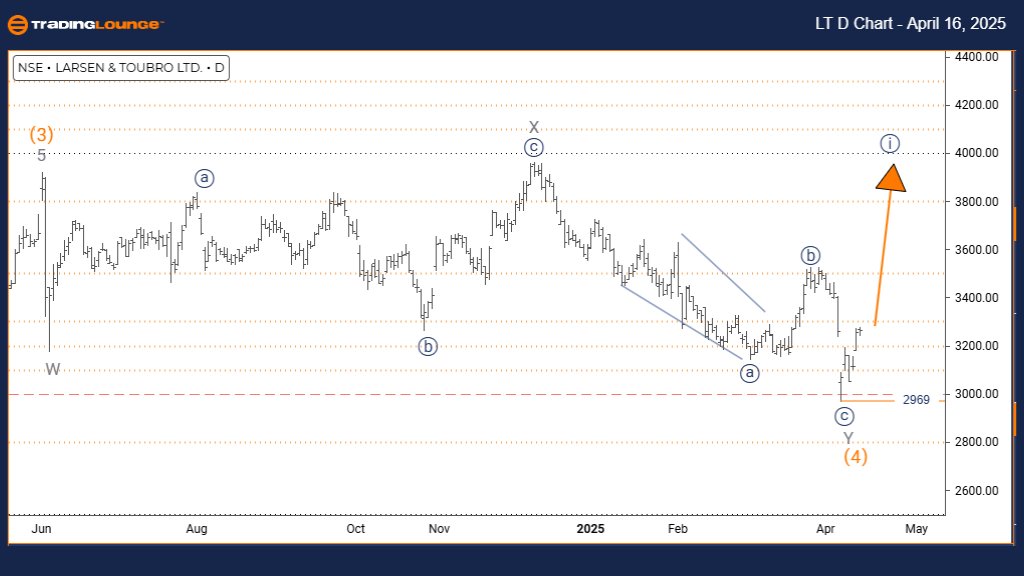
LARSEN & TOUBRO – Elliott Wave Analysis | TradingLounge Daily Chart
LARSEN & TOUBRO Elliott Wave Technical Analysis – Daily Timeframe
FUNCTION: Bullish Trend
MODE: Impulsive
STRUCTURE: Navy Blue Wave 1
POSITION: Gray Wave 1
NEXT LOWER DEGREE DIRECTION: Navy Blue Wave 2
DETAILS: Orange Wave 4 appears complete; Navy Blue Wave 1 of Gray Wave 1 is now unfolding.
Wave Invalidation Level: 2969
LARSEN & TOUBRO’s daily Elliott Wave chart indicates the early phase of a bullish impulsive trend. The recent completion of Orange Wave 4 has paved the way for the development of Navy Blue Wave 1 within a broader Gray Wave 1 structure. This initial wave typically signals the foundation of a fresh upward trend, characterized by steady gains as momentum begins to build.
Navy Blue Wave 1 often unfolds gradually, acting as the base for more aggressive price action expected in later waves, particularly Wave 3. The current formation supports a strengthening bullish sentiment, suggesting that the stock may continue trending higher in the short to medium term.
Outlook and Key Price Levels:
The next anticipated move is a pullback in Navy Blue Wave 2, a corrective wave that may present buying opportunities before Navy Blue Wave 3 takes shape. The invalidation level at 2969 is a critical marker—if breached, the current wave count would be reconsidered.
Trading Strategy Notes:
This wave structure on the daily chart is essential for early trend positioning. Traders should observe price and volume behavior to confirm the integrity of Navy Blue Wave 1. Measured price appreciation and increasing volume are typical features at this stage. Monitoring technical indicators can further validate the wave count and prepare for entry setups ahead of Wave 2.
With the Gray Wave 1 framework now initiating, this represents a key bullish setup that could lead to stronger upward moves, making it valuable for swing and trend-following strategies.
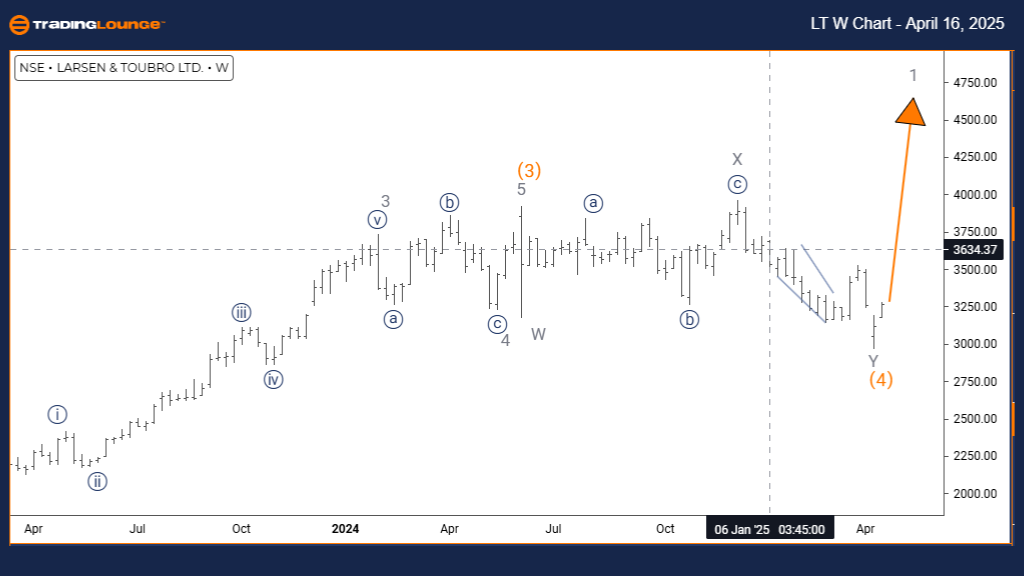
LARSEN & TOUBRO – Elliott Wave Analysis | TradingLounge Weekly Chart
LARSEN & TOUBRO Elliott Wave Technical Analysis – Weekly Timeframe
FUNCTION: Bullish Trend
MODE: Impulsive
STRUCTURE: Gray Wave 1
POSITION: Orange Wave 5
NEXT HIGHER DEGREE DIRECTION: Gray Wave 1 (Initiated)
DETAILS: Orange Wave 4 correction is complete; Gray Wave 1 of Orange Wave 5 is now underway.
LARSEN & TOUBRO’s weekly Elliott Wave chart confirms a continuation of the bullish impulse, now entering the final phase of the Orange Wave 5 sequence. The breakout from Orange Wave 4 sets the stage for Gray Wave 1, which typically initiates a new leg in the current trend cycle.
Gray Wave 1 reflects renewed upward momentum and could drive the price to new highs as the market follows through with Wave 5 dynamics. This segment is crucial in the broader wave structure, often exhibiting solid buying interest and increasing trading volumes.
Market Outlook and Trend Structure:
The weekly chart illustrates a likely final push in the larger bullish cycle. Orange Wave 5 marks the concluding wave in the sequence, so traders should remain alert for trend maturity signals. While strong gains are possible in Gray Wave 1, it also serves as a time to prepare for a shift into a corrective structure.
Trading Strategy Insights:
Traders and investors should focus on identifying continuation signals such as price breakouts and volume expansions. Staying long during this impulse is generally supported by the Elliott Wave context, but caution is warranted as the pattern matures.
Watch for indicators like momentum divergence or weakening trend strength—common signs that the wave may be approaching completion. This stage offers a strategic window to participate in the trend’s final leg while preparing exit strategies ahead of a potential reversal.a
Technical Analyst: Malik Awais
Source: visit Tradinglounge.com and learn From the Experts Join TradingLounge Here
Previous: GRASIM INDUSTRIES Elliott Wave Technical Analysis
VALUE Offer - Buy 1 Month & Get 3 Months!Click here
Access 7 Analysts Over 200 Markets Covered. Chat Room With Support