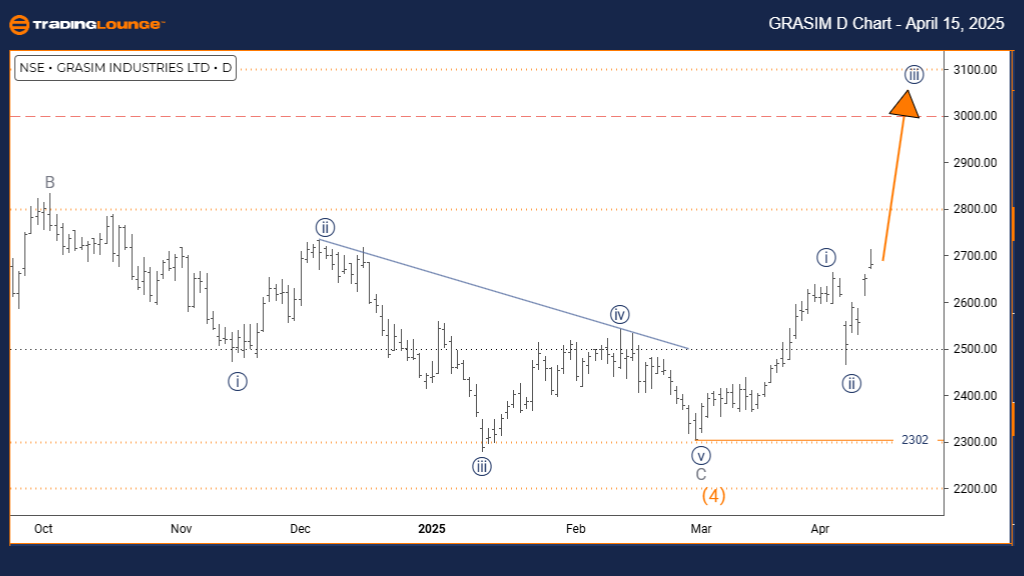
GRASIM INDUSTRIES Elliott Wave Analysis – Trading Lounge Day Chart
GRASIM INDUSTRIES Day Chart Analysis
GRASIM INDUSTRIES Elliott Wave Technical Analysis
FUNCTION: Bullish Trend
MODE: Impulsive
STRUCTURE: Navy Blue Wave 3
POSITION: Gray Wave 1
DIRECTION NEXT LOWER DEGREES: Navy Blue Wave 4
DETAILS: Completion of Navy Blue Wave 2; Navy Blue Wave 3 of 1 now in progress
WAVE CANCEL INVALID LEVEL: 2302
The GRASIM INDUSTRIES daily Elliott Wave chart reveals a strong bullish trend through an impulsive wave structure. With navy blue wave 2 now completed, the stock has commenced wave 3, unfolding within the broader gray wave 1. This impulsive setup typically signals strong upside potential and aligns with a larger uptrend across higher timeframes.
Wave 3 is commonly the most powerful wave within the Elliott Wave cycle, often showing strong momentum and extended price action. The transition from wave 2 to wave 3 usually sparks rapid growth, suggesting bullish continuation. As GRASIM INDUSTRIES progresses through this phase, traders can anticipate sharp upward movements before the next correction emerges.
The upcoming move will likely be navy blue wave 4, a corrective pullback that follows wave 3. This may offer a temporary dip or buying opportunity within the ongoing bullish sequence. Importantly, a decline below 2302 would invalidate this wave count, requiring a new analysis.
With the current daily setup indicating strength, traders should remain focused on key impulsive traits such as high momentum, breakouts, and increasing volume. The continuation of gray wave 1 further confirms the potential for sustained upside, supporting a bullish bias as long as the price remains above the invalidation level.
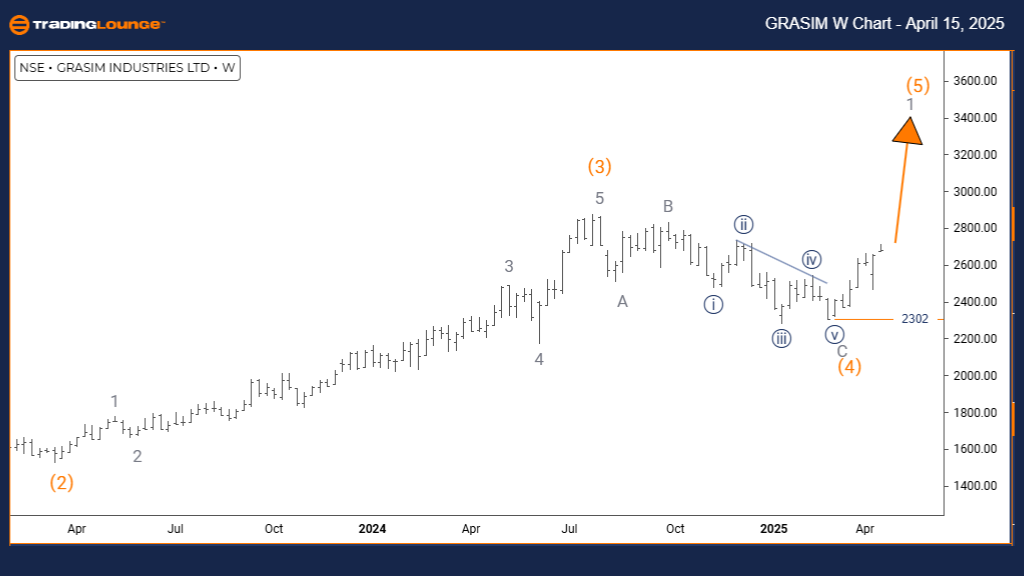
GRASIM INDUSTRIES Elliott Wave Analysis – Trading Lounge Weekly Chart
GRASIM INDUSTRIES Elliott Wave Technical Analysis
FUNCTION: Bullish Trend
MODE: Impulsive
STRUCTURE: Gray Wave 1
POSITION: Orange Wave 5
DIRECTION NEXT LOWER DEGREES: Gray Wave 2
DETAILS: Orange Wave 4 is complete; Gray Wave 1 of 5 now developing
WAVE CANCEL INVALID LEVEL: 2302
The GRASIM INDUSTRIES weekly Elliott Wave chart shows a bullish impulse wave unfolding within orange wave 5, the final leg of the broader uptrend. The completion of orange wave 4 signals the start of gray wave 1, initiating this last upward phase before a major correction could occur.
Gray wave 1 often brings renewed strength, driven by trend-following momentum and bullish sentiment. This early stage of wave 5 tends to offer significant price advancement, providing key opportunities for traders before the sequence nears its terminal point. The technical structure supports continued gains as this leg matures.
After gray wave 1 concludes, a corrective gray wave 2 is expected. This pullback phase could present a brief retracement before the market resumes upward within the remaining portion of orange wave 5. This phase offers traders a broader outlook into late-stage Elliott Wave development.
Monitoring the 2302 level is essential. A move below this would invalidate the current count and indicate a structural shift. This level also serves as a vital support zone, aligning with the end of wave 4.
Overall, the analysis favors a bullish outlook throughout this impulsive phase. However, traders should stay alert to potential volatility and signals of wave exhaustion. Watching for divergences in momentum and trend-confirming indicators can help gauge the wave's maturity and prepare for potential reversals post-wave 5.
Technical Analyst: Malik Awais
Source: visit Tradinglounge.com and learn From the Experts Join TradingLounge Here
Previous: ASIAN PAINTS Elliott Wave Technical Analysis
VALUE Offer - Buy 1 Month & Get 3 Months!Click here
Access 7 Analysts Over 200 Markets Covered. Chat Room With Support