USDJPY Elliott Wave Analysis: Trading Lounge Daily Chart
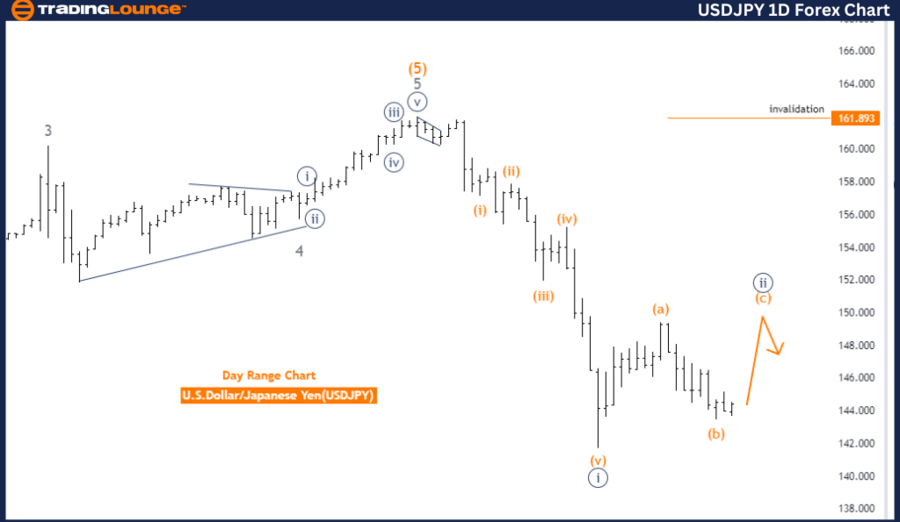
U.S. Dollar / Japanese Yen (USDJPY) Daily Chart Analysis
USDJPY Elliott Wave Technical Analysis
-
Function: Counter Trend
-
Mode: Corrective
-
Structure: Navy Blue Wave 2
-
Direction Next Lower Degrees: Navy blue wave 3
-
Details: Navy Blue Wave 1 appears complete, with Navy Blue Wave 2 currently in progress.
- Wave Cancel Invalid Level: 161.893
The USDJPY daily chart analysis, utilizing Elliott Wave theory, indicates that the pair is in a counter-trend phase. This phase is categorized as corrective, signifying a temporary reversal or consolidation within the broader trend. The main structure under observation is Navy Blue Wave 2, suggesting that the market is within the second wave of a larger corrective sequence.
The analysis reveals that navy blue wave 1 seems to have completed, and the pair is now forming navy blue wave 2. Typically, wave 2 involves a retracement of the previous impulsive wave, in this case, wave 1. The conclusion of wave 1 and the current development of wave 2 suggest the market is undergoing a consolidation or correction phase before potentially resuming the broader trend.
The direction for the next lower degrees indicates that after the completion of Navy Blue Wave 2, the market may progress to Navy Blue Wave 3. According to Elliott Wave theory, wave 3 is often the most powerful and extended wave in a trend, suggesting that once the corrective wave 2 concludes, significant movement in the direction of the primary trend could follow.
A crucial level to monitor is 161.893, marked as the wave cancel invalid level. If the price reaches or surpasses this level, it would invalidate the current Elliott Wave structure, signaling a potential shift in market dynamics and possibly leading to the formation of a new wave pattern.
In summary, the USDJPY pair is presently in a corrective phase on the daily chart, forming Navy Blue Wave 2 following the completion of Navy Blue Wave 1. The key level to watch for potential invalidation of this wave structure is 161.893.
USDJPY Elliott Wave Analysis: Trading Lounge Daily Chart
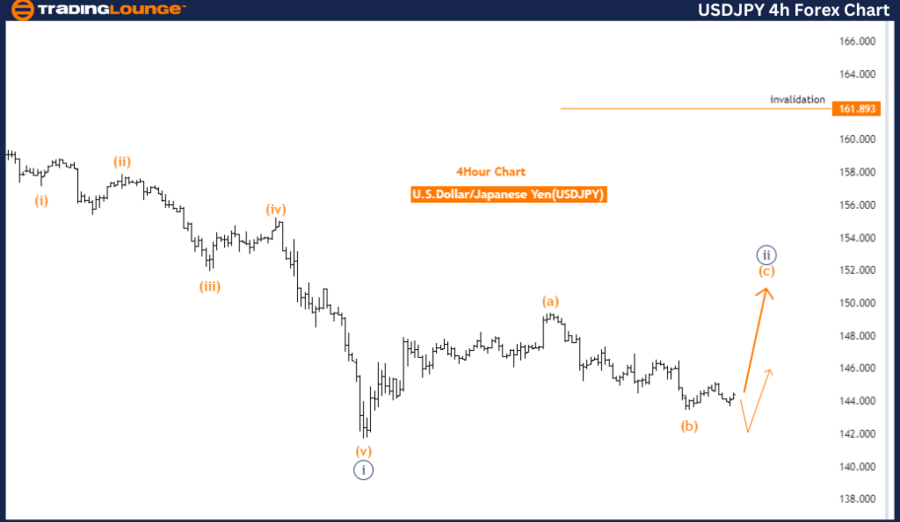
U.S. Dollar / Japanese Yen (USDJPY) 4-Hour Chart Analysis
USDJPY Elliott Wave Technical Analysis
-
Function: Counter Trend
-
Mode: Impulsive as C
-
Structure: Orange wave C
-
Position: Navy Blue Wave 2
-
Direction Next Lower Degrees: Navy blue wave 3
-
Details: Orange wave B of C appears complete, and orange wave C of 2 is currently in progress.
- Wave Cancel Invalid Level: 161.893
The USDJPY 4-hour chart analysis, based on Elliott Wave theory, suggests that the pair is undergoing a counter-trend movement. This movement indicates that the price action is moving against the prevailing trend, likely as part of a corrective phase. The analysis identifies the market is in an impulsive mode within orange wave C, which is part of a larger corrective structure.
The market's position is in navy blue wave 2, signifying that the pair is in the second wave of a larger cycle, where corrections typically occur. The analysis suggests that orange wave B of C has completed, and the market has now entered orange wave C of navy blue wave 2. This ongoing corrective phase implies that the price may continue to move within this structure before potentially resuming the broader trend.
The direction for the next lower degrees points to the development of navy blue wave 3 after the completion of the current wave C. This suggests that once the corrective phase concludes, the pair might resume its impulsive movement in line with the larger trend.
A critical level to monitor is 161.893, identified as the wave cancel invalid level. If the price reaches or exceeds this level, the current Elliott Wave structure could be invalidated, indicating a potential shift in market dynamics, possibly leading to a different wave pattern or trend direction.
In summary, the USDJPY pair is currently in a counter-trend phase on the 4-hour chart, positioned in navy blue wave 2. The completion of orange wave B of C has led to the development of orange wave C, which is currently in progress. The key level to monitor for potential invalidation of this wave structure is 161.893.
Technical Analyst: Malik Awais
Source: visit Tradinglounge.com and learn From the Experts Join TradingLounge Here
Previous: Australian Dollar/U.S. Dollar Elliott Wave Technical Analysis
Special Trial Offer - 0.76 Cents a Day for 3 Months! Click here
Access 7 Analysts Over 200 Markets Covered. Chat Room With Support