AUDJPY Elliott Wave Analysis Trading Lounge Day Chart,
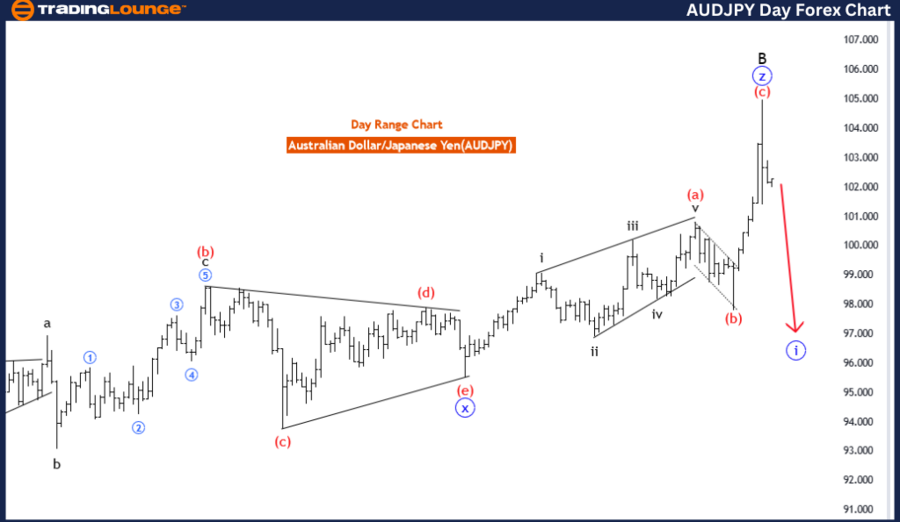
Australian Dollar / Japanese Yen (AUDJPY) Day Chart
AUDJPY Elliott Wave Technical Analysis
FUNCTION: Counter Trend
MODE: impulsive as C
STRUCTURE: blue wave 1
POSITION: blue wave 1
DIRECTION NEXT HIGHER DEGREES: blue wave 2
DETAILS: black wave 2 completed at 104.996,now blue wave 1 of black wave C is in play . Wave Cancel invalid level:104.990
The AUD/JPY Elliott Wave Analysis for the Day Chart provides insights into the price action of the Australian Dollar against the Japanese Yen. It explores the wave structure, current positioning, and potential market movements, essential for Elliott Wave analysts and technical traders.
Function
The analysis defines the function as "Counter Trend," indicating that the current wave pattern opposes the broader market trend. This function typically consists of corrective waves or trend reversals, leading to more complex price action.
Mode
The mode is characterized as "impulsive as C," suggesting that the wave structure represents an impulsive wave within a corrective phase. This mode is generally composed of five waves, indicating a significant market move.
Structure
The structure is identified as "blue wave 1," signaling that the current phase is the beginning of a broader impulsive wave within a corrective context. This could be an initial push upward before a subsequent correction and further trend continuation.
Position
The position is described as "blue wave 1," indicating that the market is in the first wave of a new impulse sequence, suggesting that a larger trend might be forming or reversing.
Direction for the Next Higher Degrees
The expected direction for the next higher degrees is "blue wave 2," indicating that after the current impulsive wave completes, a corrective phase is likely to follow before the trend continues. This is a key point for traders looking for entry opportunities within a corrective structure.
Details
The details section provides a deeper look at the wave structure. According to the analysis, "black wave 2" completed at 104.996, with "blue wave 1" of black wave C currently in play. The "Wave Cancel invalid level" is set at 104.990, indicating that if the price crosses this threshold, the current wave structure could be invalidated, suggesting a potential shift in market dynamics.
In summary, the AUD/JPY Elliott Wave Analysis for the Day Chart indicates that the market is in an impulsive phase within a counter-trend context. Black wave 2 completed at 104.996, and blue wave 1 of black wave C is in play, with a potential transition to a corrective phase (blue wave 2) expected. The Wave Cancel invalid level is set at 104.990, providing a critical level for monitoring the validity of the current wave structure. This analysis can be useful for traders and analysts seeking to understand the current market context and predict potential price movements.

AUDJPY Elliott Wave Analysis Trading Lounge 4 Hour Chart,
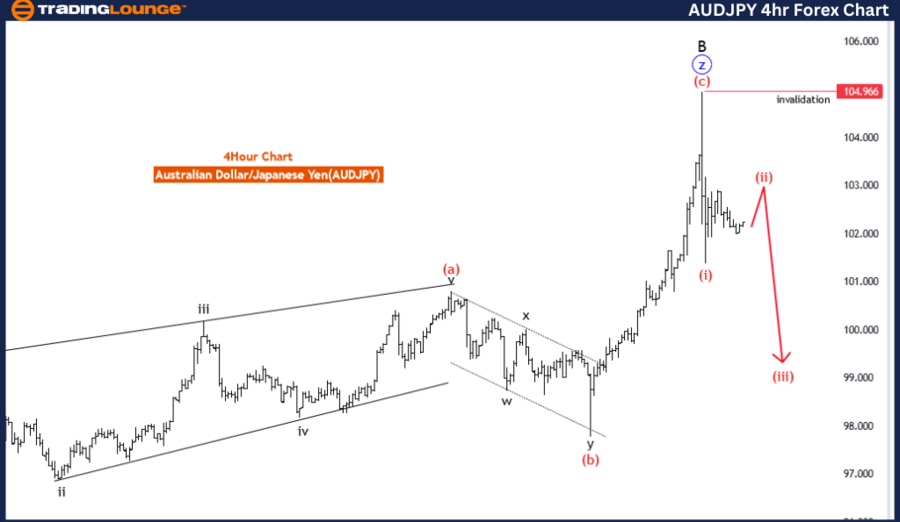
Australian Dollar / Japanese Yen (AUDJPY) 4 Hour Chart
AUDJPY Elliott Wave Technical Analysis
FUNCTION: Trend
MODE: corrective
STRUCTURE: red wave 2
POSITION: blue wave 1
DIRECTION NEXTLOWER DEGREES: red wave 3
DETAILS: red wave 1 of blue wave 1 completed at 101.393 , now red wave 2 is in play . Wave Cancel invalid level:104.966
The AUD/JPY Elliott Wave Analysis for the 4-Hour Chart provides a technical outlook on the movement of the Australian Dollar against the Japanese Yen. It highlights the wave structure, current positioning, and anticipated market direction, which is crucial for traders and analysts.
Function
The analysis defines the function as "Trend," suggesting that the current market movement follows the prevailing trend rather than opposing it. This function is often characterized by more predictable price action, with clear impulse and corrective waves.
Mode
The mode is described as "corrective," indicating that the current wave pattern represents a correction within the broader trend. Corrective waves often occur in zigzags, flats, or other complex patterns, serving as a retracement before the trend resumes.
Structure
The structure is identified as "red wave 2," signaling that the current wave is part of a larger corrective phase within the impulse sequence. This correction phase can offer buying opportunities for trend-following traders.
Position
The position is "blue wave 1," indicating that the current corrective phase is part of a larger impulse sequence within the broader trend. This position suggests that the market may soon transition from correction to impulse, providing direction for future trades.
Direction for the Next Lower Degrees
The expected direction for the next lower degrees is "red wave 3," suggesting that once the current corrective phase completes, a new impulse wave (red wave 3) will likely emerge, driving the price movement in a more significant direction.
Details
The details section sheds light on the current state of the wave structure. According to the analysis, "red wave 1 of blue wave 1" is completed at 101.393. Currently, "red wave 2" is in play, indicating that the market is in the corrective phase of an overall uptrend. The "Wave Cancel invalid level" is set at 104.966, which means that if the price crosses this level, the current wave structure could be invalidated, suggesting a shift in market dynamics.
In summary, the AUD/JPY Elliott Wave Analysis for the 4-Hour Chart suggests that the market is in a corrective phase within a broader trend. Red wave 1 of blue wave 1 is complete, and red wave 2 is now in play, potentially leading to a new impulse phase. The Wave Cancel invalid level is 104.966, providing a key reference point for market invalidation. This analysis is useful for traders seeking to understand the current market context and anticipate future movements.
Technical Analyst: Malik Awais
Source: visit Tradinglounge.com and learn From the Experts Join TradingLounge Here
See Previous: British Pound/ Australian Dollar (GBPAUD)
Special Trial Offer - 0.76 Cents a Day for 3 Months! Click here
Access 6 Analysts covering over 150 Markets. Chat Room With Support
