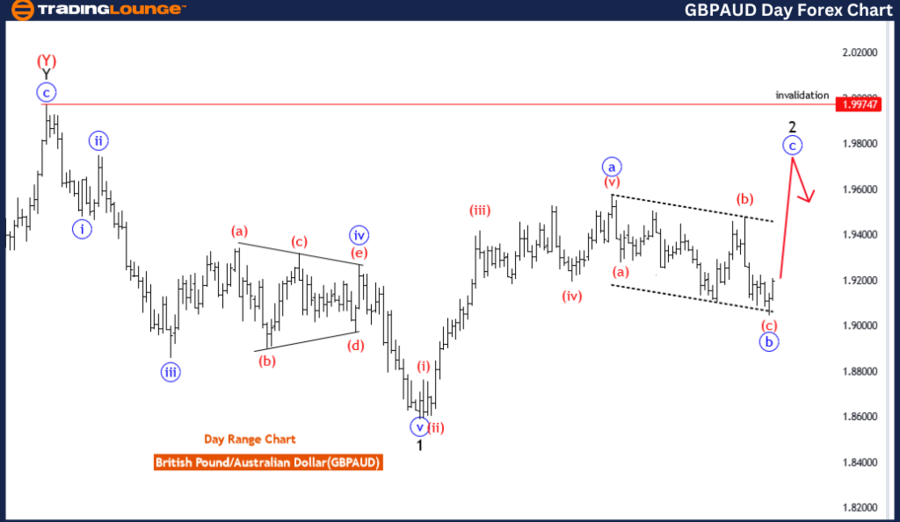
GBPAUD Elliott Wave Analysis Trading Lounge Day Chart,
British Pound/ Australian Dollar (GBPAUD) Day Chart Analysis
GBPAUD Elliott Wave Technical Analysis
FUNCTION: Counter Trend
MODE: Corrective
STRUCTURE: Blue wave
POSITION: black wave 2
DIRECTION NEXT HIGHER DEGREES: black wave 3
DETAILS: red wave C of B looking completed, now blue wave C of 2 is in play. Wave Cancel invalid level: 1.99747
The GBPAUD Elliott Wave Analysis for the Day Chart offers insights into the ongoing corrective movements in the British Pound/Australian Dollar (GBPAUD) pair. This analysis details the current wave structure and provides key information for traders seeking to understand potential trend reversals or continuations.
Function
The analysis describes the function as "Counter Trend," suggesting that the current market movement opposes the broader trend. This is a critical indication for traders who may be considering short-term trades within a larger trend context.
Mode
The mode is categorized as "Corrective," which indicates that the current wave pattern is part of a larger correction phase. Corrective waves tend to be more complex and less directional, often comprising various sub-waves that challenge the prevailing trend.
Structure
The structure is identified as "Blue wave C," indicating that the market is in the final stages of a corrective phase. This phase often precedes a shift in trend direction or the start of a new impulse wave sequence.
Position
The position within the wave structure is described as "black wave 2." This indicates that the current corrective wave is nearing completion, signaling that a new wave sequence, possibly an impulse wave, might be forming.
Direction for the Next Lower Degrees
The expected direction for the next lower degrees is "black wave 3." This suggests that after the current corrective phase, there could be a strong impulse wave, leading to significant directional movement in the market.
Details
The details section provides a deeper look into the current phase of the wave structure. According to the analysis, red wave C of B is considered completed, signalling the end of this specific wave sequence. Now, blue wave C of 2 is in play, indicating that the final corrective wave is unfolding. The "Wave Cancel invalid level" is set at 1.99747, which is a crucial reference point. If the price crosses this level, the current wave structure could be invalidated, suggesting a different interpretation.
In summary, the GBPAUD Elliott Wave Analysis for the Day Chart indicates a counter-trend movement with a corrective mode. The red wave C of B is complete, and the blue wave C of 2 is now in play. The analysis points to a potential shift in market trends, with the invalidation point set at 1.99747. This analysis serves as a guide for traders looking to navigate the corrective phase and anticipate future market trends.

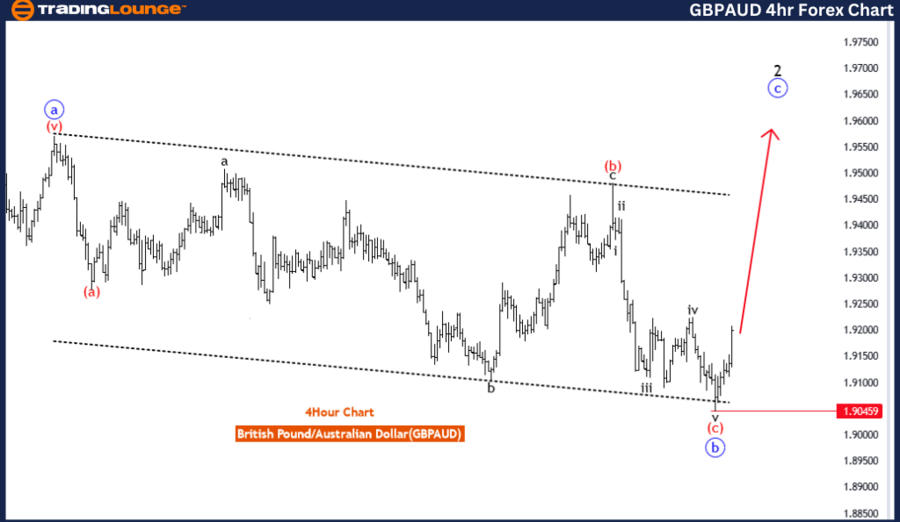
GBPAUD Elliott Wave Analysis Trading Lounge 4-Hour Chart,
British Pound/ Australian Dollar (GBPAUD) 4 Hour Chart
GBPAUD Elliott Wave Technical Analysis
FUNCTION: Counter Trend
MODE: impulsive
STRUCTURE: Blue wave
POSITION: black wave 2
DIRECTION NEXT LOWER DEGREES: black wave 3
DETAILS: red wave C of B looking completed, now blue wave C of 2 is in play. Wave Cancel invalid level: 1.90459
The GBPAUD Elliott Wave Analysis for the 4-Hour Chart provides insights into the counter-trend movements within the Elliott Wave framework. It outlines the expected wave structures, mode, and invalidation points, indicating areas of potential trend reversal or continuation.
Function
The analysis specifies the function as "Counter Trend," suggesting that the current market movement is in opposition to the prevailing broader trend. This information is useful for traders looking to identify corrective phases where reversals or minor trends occur.
Mode
The mode is described as "impulsive," indicating that the market movements are characterized by strong momentum and rapid shifts within the defined wave structure. This behavior is typical during phases where trends exhibit clear directionality.
Structure
The structure is defined as "Blue wave C," indicating that the analysis is observing the final wave in a corrective sequence. The completion of this wave generally leads to the beginning of a new cycle or a reversal in trend direction.
Position
The position within the wave structure is "black wave 2." This position signifies a pivotal point within a broader corrective phase, indicating that a new wave sequence might be forming or in progress.
Direction for the Next Lower Degrees
The expected direction for the next lower degrees is "black wave 3," suggesting that the analysis anticipates a significant shift toward a new impulse wave in the broader trend. This can lead to a strong directional movement in the market.
Details
The details offer a more in-depth look at the current phase of the wave structure. The red wave C of B is observed to be completed, signaling the end of a specific wave sequence. Now, the blue wave C of 2 is currently in play, suggesting that the final stages of this corrective structure are unfolding. The "Wave Cancel invalid level" is set at 1.90459, which is a crucial point for validating or invalidating the current wave structure. Crossing this level would suggest a different interpretation of the Elliott Wave structure.
In summary, the GBPAUD Elliott Wave Analysis for the 4-Hour Chart points to a counter-trend movement with an impulsive mode. The analysis indicates that red wave C of B has concluded, leading to blue wave C of 2. This shift suggests that the market is nearing the end of the corrective phase, with an invalidation point at 1.90459. The analysis provides a roadmap for traders seeking to understand the current phase and anticipate future market movements.
Technical Analyst: Malik Awais
Source: visit Tradinglounge.com and learn From the Experts Join TradingLounge Here
See Previous: U.S.Dollar/Swiss Franc (USD/CHF)
Special Trial Offer - 0.76 Cents a Day for 3 Months! Click here
Access 6 Analysts covering over 150 Markets. Chat Room With Support
