McDonald’s Corp., Elliott Wave Technical Analysis
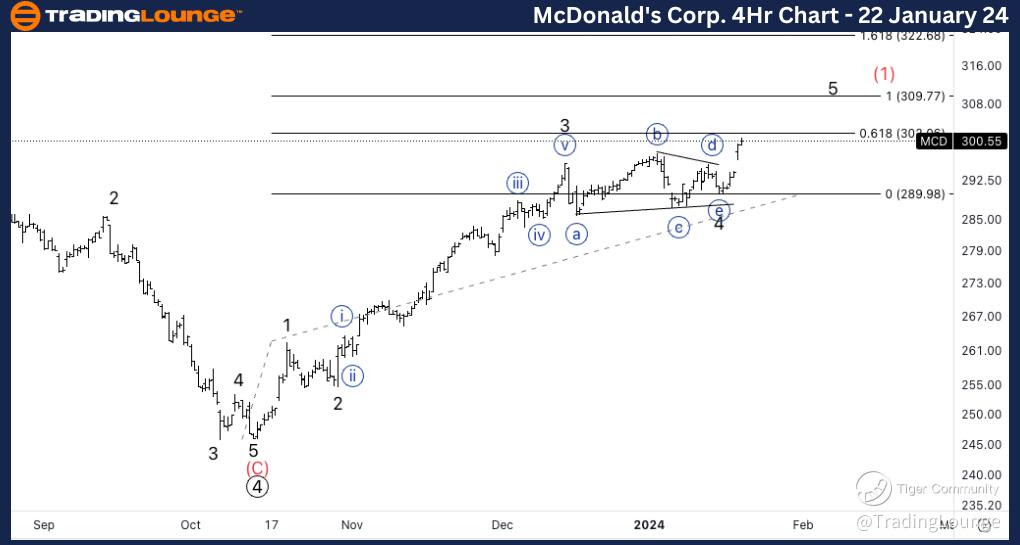
McDonald’s Corp., (MCD:NYSE): 4h Chart 22 January 24
MCD Stock Market Analysis: Moving higher as expected after the triangle. As we have now broke previous ATH and we are trading around Major Level 300$, we should be mindful of potential downside anytime.
MCD Elliott Wave Count: Wave {i} of 5.
MCD Technical Indicators: Above all averages.
MCD Trading Strategy: Looking for longs on a pullback in wave {ii}.
TradingLounge Analyst: Alessio Barretta
Source: Tradinglounge.com get trial here!
Previous: Meta Platforms Inc.

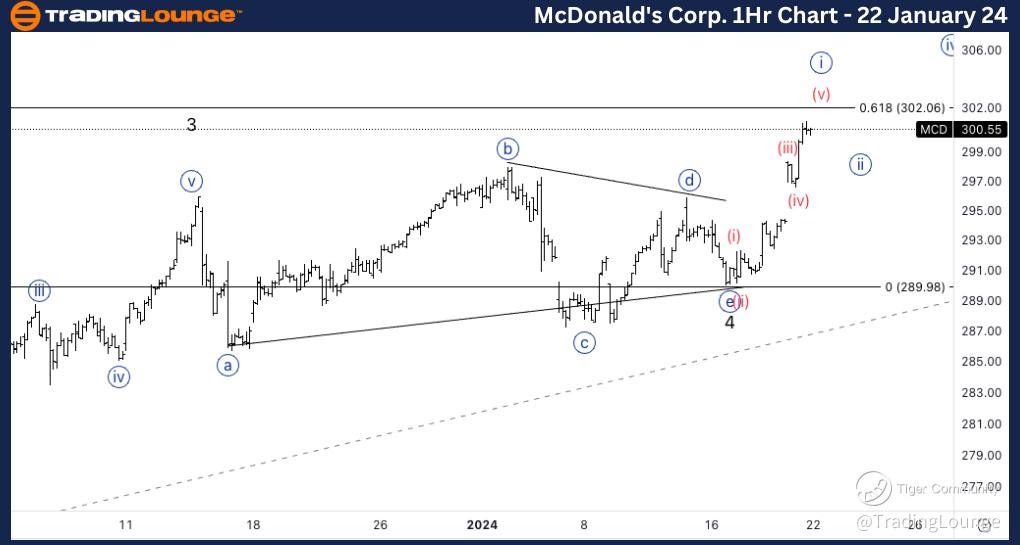
McDonald’s Corp., MCD: 1-hour Chart 22 January 24
McDonald’s Corp., Elliott Wave Technical Analysis
MCD Stock Market Analysis: Looking for a potential top in wave {i}, which could also be wave 5 as we approach 0.618 5 vs. 1. Ideal target stands at equality of 5 vs. 1. We can start to look for longs if we find support on the 300 and see a CTLP.
MCD Elliott Wave count: Wave {i} of 5.
MCD Technical Indicators: Above all averages.
MCD Trading Strategy: Looking for longs on a pullback in wave {ii}.
