06Sep

Visa Inc. (V) Stocks Elliott Wave Technical Analysis: Key Price Levels and Stock Forecast for Bullish Momentum

V Elliott Wave Analysis for Visa Inc. (V) Stock

This Elliott Wave analysis examines Visa Inc. (V) using both the daily and 1-hour charts, offering a comprehensive outlook on the current market trend, structure, and significant price levels.

V Elliott Wave Analysis: TradingLounge Daily Chart

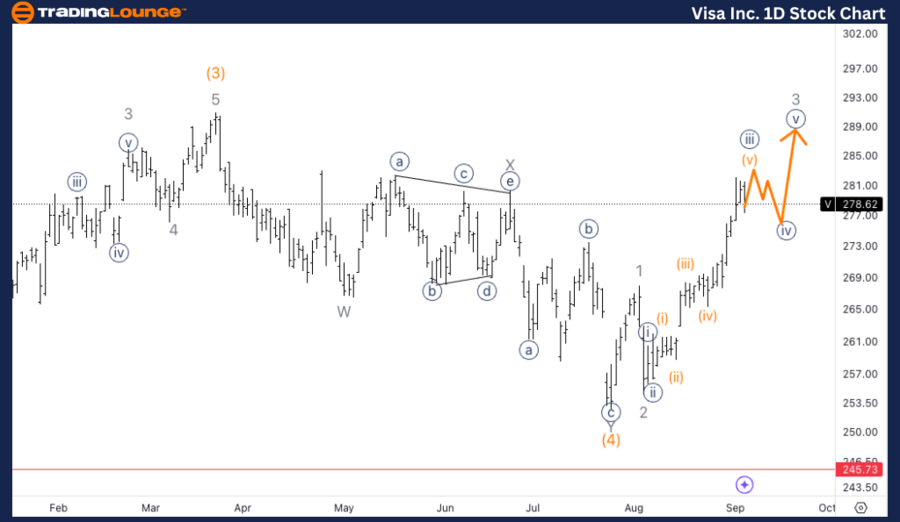
Visa Inc. (V) Daily Chart Analysis

V Elliott Wave Technical Analysis

Function: Trend

Mode: Impulsive

Structure: Motive

Position: Wave {iii} of 3

Direction: Upside into wave 3

Details: The subdivision within wave {iii} appears to have formed a five-wave move, signaling the potential completion of wave {iii}. Visa's price has approached the critical level of Minor Group 2 at $280, which may mark the top of wave {iii}.

Visa Stock Elliott Wave Analysis

Visa is currently advancing in wave {iii} of 3, characterized by a clear five-wave subdivision. As the stock approaches the Minor Group 2 level at $280, a significant resistance area, wave {iii} is likely nearing completion. Following this, a corrective phase in wave {iv} could unfold, offering the market a consolidation opportunity before resuming the upward momentum in the next wave.

Visa-Inc-1D-Stock-Ch...


V Elliott Wave Analysis: TradingLounge 1-Hour Chart

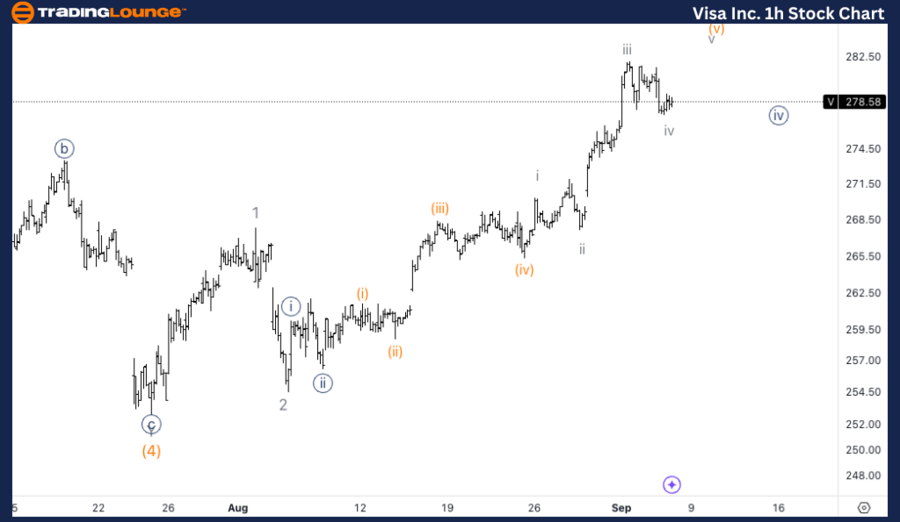
Visa Inc. (V) 1-Hour Chart Analysis

V Elliott Wave Technical Analysis

Function: Trend

Mode: Impulsive

Structure: Motive

Position: Wave iv of (v)

Direction: Upside in wave (v)

Details: Wave iv of (v) is in progress, with Visa consolidating just below the critical $280 level, a Classic Trading Level. Upon completing wave iv, Visa is expected to move higher into wave v of (v), with the potential to surpass the $280 resistance level.

Visa INC Technical Analysis

Visa is currently in wave iv of (v) within the larger wave {iii}. The price is consolidating near the $280 Classic Trading Level. After wave iv completes, a bullish continuation is expected in wave v of (v), with a possible break above the $280 level. Such a breakout would confirm the strength of the uptrend, signaling further bullish potential for Visa.

Technical Analyst: Alessio Barretta

Source: visit Tradinglounge.com and learn From the Experts Join TradingLounge Here 

See Previous: PayPal Holdings Inc. (PYPL) Elliott Wave Technical Analysis

Special Trial Offer - 0.76 Cents a Day for 3 Months! Click here

Access 7 Analysts Over 200 Markets Covered. Chat Room With Support

Visa-Inc-1H-Stock-Ch...

Related

Australian Dollar/U.S. Dollar (AUDUSD) Elliott Wave Analysis: Accurate Currency Forecasts and Forex Technical Insights

Australian Dollar/U.S. Dollar (AUDUSD) Elliott Wave Analysis: Accurate Currency Forecasts and Forex Technical Insights

The AUDUSD Elliott Wave analysis provides a detailed look at the current market trends, focusing on ...

Read More >
SuperMicro Computers Inc. (SMCI) Elliott Wave Forecast: Final Wave {v} & $50 Breakout Setup for Bullish SuperMicro Stock Trend Return

SuperMicro Computers Inc. (SMCI) Elliott Wave Forecast: Final Wave {v} & $50 Breakout Setup for Bullish SuperMicro Stock Trend Return

SMCI Elliott Wave analysis shows SuperMicro nearing completion of corrective flat on daily chart (wa...

Read More >
Dogecoin Elliott Wave Analysis: DOGE Price Prediction, Wave Count, Support & Resistance Levels for Crypto Investors

Dogecoin Elliott Wave Analysis: DOGE Price Prediction, Wave Count, Support & Resistance Levels for Crypto Investors

Dogecoin Elliott Wave analysis, helping traders understand the DOGEUSD market structure. Learn about...

Read More >
Ideal for investors seeking accurate CAT stock analysis: Caterpillar Inc. (CAT) Elliott Wave Technical Analysis

Ideal for investors seeking accurate CAT stock analysis: Caterpillar Inc. (CAT) Elliott Wave Technical Analysis

This article provides an in-depth Elliott Wave analysis of Caterpillar Inc. (CAT), offering detailed...

Read More >
Mastering DOGEUSD Trading: Dogecoin/ U.S. dollar (DOGEUSD) Elliott Wave Technical Analysis

Mastering DOGEUSD Trading: Dogecoin/ U.S. dollar (DOGEUSD) Elliott Wave Technical Analysis

Explore Elliott Wave Technical Analysis for Dogecoin/ U.S. dollar (DOGEUSD) on daily and 4-hour char...

Read More >
Caterpillar Inc. Elliott Wave Technical Analysis: Corrective Wave Trends, Technical Patterns, and Price Target Insights for Traders

Caterpillar Inc. Elliott Wave Technical Analysis: Corrective Wave Trends, Technical Patterns, and Price Target Insights for Traders

Caterpillar Inc. (CAT), highlighting potential bottom formations in wave {iv} and future price targe...

Read More >

$1 for 2 Weeks

then $29 a month!

What a Special Offer!

Trade Recommendations

Unleash the power of deversified trading with our comprehensive portfolio, covering 250+ markets:

  • Stock Trades
  • Crypto Trades
  • Forex Trades
  • Commodity Trades
Elliott Wave Analysis

Gain a competitive edge with expert insights and AI-powered Elliott Wave charting into:

  • Global Indices
  • US Stocks & ASX Stocks
  • Forex & Crypto
  • Commodities
Top-Notch Trading Tools

Equip yourself with the tools of success:

  • Real-time Chat rooms
  • Elliott Wave Algorithm
  • Portfolio tools
  • TradingLevels
  • Screener
  • Trading Game
7 Elliott Wave Analysts

Stay ahead of the market with daily charts and insightful videos
Your secret to strategic trading!

JOIN HERE


Welcome to TradingLounge (ASIC A.R.No. 321187), specialists in trades, trading education and technical analysis, covering stocks, indices, commodities, forex and cryptocurrencies.

When you join TradingLounge you have access to everything we offer, including trade tools, educational content and a social platform to chat with like-minded investors.

Read more

@Copyright 2024 by tradinglounge.com

Contact Us

Australian no: 02 4787 6020

International no: +61 (2) 47876020

Pay with:

Find us on