PayPal Holdings Inc. (PYPL) Elliott Wave Analysis: Comprehensive Breakdown

This analysis delves into PayPal Holdings Inc. (PYPL), utilizing the Elliott Wave Theory to assess the current market structure and forecast potential future movements. We focus on both the daily and 1-hour charts for a complete view.

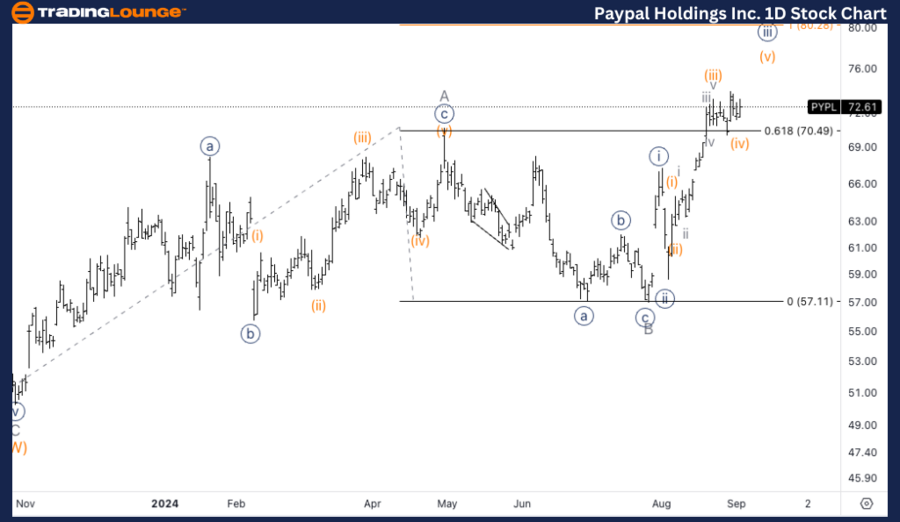
PYPL Elliott Wave Analysis: Trading Lounge Daily Chart

PayPal Holdings Inc. (PYPL) Daily Chart Analysis

PYPL Elliott Wave Technical Analysis

Function: Trend

Mode: Impulsive

Structure: Motive

Position: Wave 3 or C

Direction: Upside in wave 3/C

Details:
The analysis identifies an upside potential within wave 3 or C, which is expected to unfold in a five-wave structure. Currently, the market seems to be within wave {iii}. The equality between wave 3 and wave 1 stands at Trading Level 8, around $80, often a minimum target for wave 3 or C.

PYPL Elliott Wave Analysis – Daily Chart

PYPL is in wave 3 or C, a phase characterized by strong upward momentum. The equality level of wave 3 compared to wave 1 suggests a potential target around Trading Level 8 at $80. As wave {iii} develops further, reaching the $80 target appears likely in the near future.

Paypal-Holdings-Inc-...


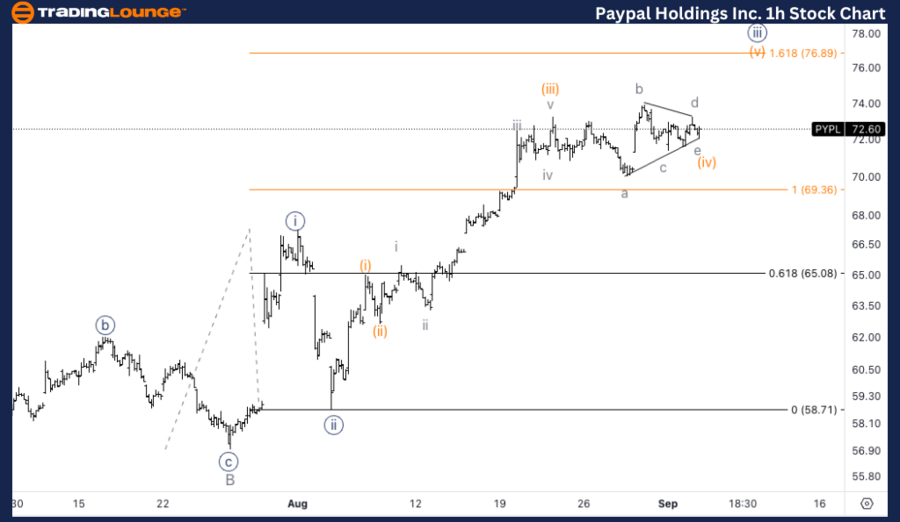
PYPL Elliott Wave Analysis: Trading Lounge 1H Chart

PayPal Holdings Inc. (PYPL) 1H Chart Analysis

PYPL Stock Technical Analysis

Function: Trend

Mode: Impulsive

Structure: Motive

Position: Wave (iv) of {iii}

Direction: Upside in wave {iii}

Details:
In the 1-hour chart, PYPL is forming a triangle correction in wave (iv) of {iii}. Once this correction is completed, the price is expected to continue upward toward the 1.618 Fibonacci extension of wave {iii} versus wave {i}. This next leg up, wave (v) of {iii}, could push the stock price toward the anticipated $80 target.

PYPL Elliott Wave Technical Analysis – 1H Chart

Currently, PYPL is in wave (iv) of {iii}, where a triangle pattern appears to be nearing completion. Once the triangle correction concludes, the price is likely to resume its upward trajectory, targeting the 1.618 Fibonacci extension of wave {iii} compared to wave {i}. The anticipated upward move in wave (v) of {iii} could lead the price toward the $80 target.

Technical Analyst: Alessio Barretta

Source: visit Tradinglounge.com and learn From the Experts Join TradingLounge Here 

See Previous: Palo Alto Networks Inc. (PANW) Elliott Wave Technical Analysis

Special Trial Offer - 0.76 Cents a Day for 3 Months! Click here

Access 7 Analysts Over 200 Markets Covered. Chat Room With Support

Paypal-Holdings-Inc-...

Related

Discover How to leverage Elliott Wave Theory to make Informed Decisions about McDonald's Corp. Stock: MCD Elliott Wave analysis

Discover How to leverage Elliott Wave Theory to make Informed Decisions about McDonald's Corp. Stock: MCD Elliott Wave analysis

This article provides a detailed Elliott Wave analysis of McDonald's Corp. (MCD), focusing on ke...

Read More >
Examines the Commodity market's corrective wave structures for Iron Ore Elliott Wave Technical Analysis

Examines the Commodity market's corrective wave structures for Iron Ore Elliott Wave Technical Analysis

This article provides an in-depth Elliott Wave analysis of the iron ore market, focusing on current ...

Read More >
British Pound/Japanese Yen(GBPJPY) Elliott Wave Technical Analysis 5 December 23

British Pound/Japanese Yen(GBPJPY) Elliott Wave Technical Analysis 5 December 23

GBPJPY Elliott Wave Analysis Trading Lounge Day Chart for 5 December 23, delves into the technical a...

Read More >
CAC 40 (France) Elliott Wave Technical Analysis - Market Trends, Price Predictions & Trading Strategies Based on Elliott Wave Theory

CAC 40 (France) Elliott Wave Technical Analysis - Market Trends, Price Predictions & Trading Strategies Based on Elliott Wave Theory

The CAC 40 Elliott Wave Analysis provides a detailed outlook on the French stock market trends based...

Read More >
ASX LIMITED Analysis: Unlock Elliott Wave Insights, Stock Forecasts, Key Levels, and Smarter Trading Strategies for Market Success

ASX LIMITED Analysis: Unlock Elliott Wave Insights, Stock Forecasts, Key Levels, and Smarter Trading Strategies for Market Success

Stay ahead with ASX Limited Elliott Wave Analysis. Our comprehensive technical forecast includes key...

Read More >
Shanghai Composite Index Elliott Wave Technical Analysis with SSE Price Predictions, Market Trends, and Financial Insights

Shanghai Composite Index Elliott Wave Technical Analysis with SSE Price Predictions, Market Trends, and Financial Insights

This analysis provides a detailed Elliott Wave breakdown of the Shanghai Composite Index (SSE), high...

Read More >

$1 for 2 Weeks

then $29 a month!

What a Special Offer!

Trade Recommendations

Unleash the power of deversified trading with our comprehensive portfolio, covering 250+ markets:

  • Stock Trades
  • Crypto Trades
  • Forex Trades
  • Commodity Trades
Elliott Wave Analysis

Gain a competitive edge with expert insights and AI-powered Elliott Wave charting into:

  • Global Indices
  • US Stocks & ASX Stocks
  • Forex & Crypto
  • Commodities
Top-Notch Trading Tools

Equip yourself with the tools of success:

  • Real-time Chat rooms
  • Elliott Wave Algorithm
  • Portfolio tools
  • TradingLevels
  • Screener
  • Trading Game
7 Elliott Wave Analysts

Stay ahead of the market with daily charts and insightful videos
Your secret to strategic trading!

JOIN HERE


Welcome to TradingLounge (ASIC A.R.No. 321187), specialists in trades, trading education and technical analysis, covering stocks, indices, commodities, forex and cryptocurrencies.

When you join TradingLounge you have access to everything we offer, including trade tools, educational content and a social platform to chat with like-minded investors.

Read more

@Copyright 2024 by tradinglounge.com

Contact Us

Australian no: 02 4787 6020

International no: +61 (2) 47876020

Pay with:

Find us on