26May

Dow Jones Forecast Using Elliott Wave: Bullish Trend Confirmed with Impulse Wave Signals on Daily and Weekly DJI Charts

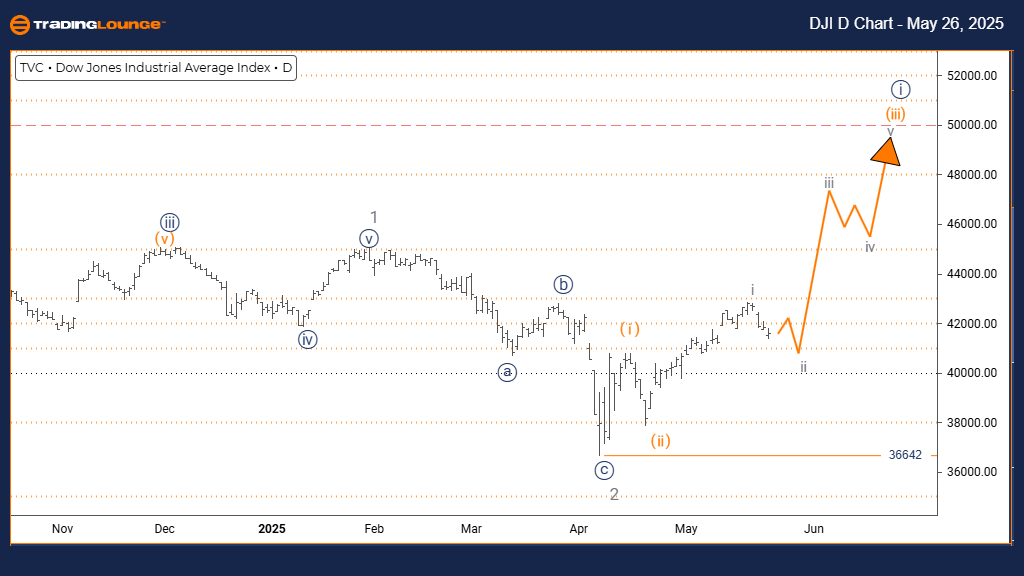
DOW JONES – DJI Elliott Wave Analysis | Trading Lounge Day Chart

DOW JONES – DJI Elliott Wave Technical Analysis

FUNCTION: Bullish Trend

MODE: Impulsive

STRUCTURE: Orange Wave 3

POSITION: Navy Blue Wave 1

DIRECTION NEXT LOWER DEGREES: Orange Wave 4

DETAILS: Orange Wave 2 has likely completed. Orange Wave 3 is currently in progress.

Invalidation Level: 36642

The daily Elliott Wave chart of the Dow Jones Industrial Average (DJI) displays robust bullish momentum, supporting an ongoing upward trend. The current pattern indicates the development of orange wave 3, part of a larger navy blue wave 1. The market has transitioned out of orange wave 2, typically marking the beginning of the most dynamic and impulsive segment.

With orange wave 2 concluded, the rally now enters the third wave, historically known for strong price acceleration. This suggests consistent institutional buying strength, reinforcing the possibility of continued upward movement. A daily close beneath 36642 would invalidate the existing count and prompt a reassessment of the wave structure.

This bullish wave count positions the DJI favorably for trend-following strategies. The anticipated short-term pullback—orange wave 4—will likely occur after the current rally completes. Traders should stay alert for trend continuation signals while managing risk as this impulsive move evolves.

dji-d-index-chart-26...


DOW JONES – DJI Elliott Wave Analysis | Trading Lounge Weekly Chart

DOW JONES – DJI Elliott Wave Technical Analysis

FUNCTION: Bullish Trend

MODE: Impulsive

STRUCTURE: Navy Blue Wave 1

POSITION: Gray Wave 3

DIRECTION NEXT LOWER DEGREES: Navy Blue Wave 2

DETAILS: Gray Wave 2 is likely complete. Navy Blue Wave 1 of 3 appears to be underway.

Invalidation Level: 36642

The weekly Elliott Wave chart for the Dow Jones Industrial Average maintains a bullish outlook, showcasing an impulsive structure with navy blue wave 1 developing inside gray wave 3. The recent completion of gray wave 2 suggests the beginning of a new upward cycle within a larger long-term trend.

This wave formation confirms the start of navy blue wave 1, driven by consistent upward pressure. The broader weekly trend implies that this bullish move may persist over a longer time horizon. An invalidation of this scenario would occur below 36642, which serves as a key reference point for reassessment.

The Elliott Wave setup highlights a favorable environment for long-term investors, aligning with the early phase of an extended rally. Following the current wave, navy blue wave 2—a corrective movement—is expected. Market participants should monitor the structure closely and adjust risk levels accordingly while staying prepared for additional upward progression.

Technical Analyst: Malik Awais

Source: Visit Tradinglounge.com and learn from the Experts. Join TradingLounge Here 

Previous: Bovespa Index Elliott Wave Technical Analysis

VALUE Offer - Buy 1 Month & Get 3 Months!Click here

Access 7 Analysts Over 200 Markets Covered. Chat Room With Support

dji-w-index-chart-26...

Related

British Pound/Australian Dollar (GBPAUD) Elliott Wave Analysis: Price Prediction and Trading Strategies for Forex Traders

British Pound/Australian Dollar (GBPAUD) Elliott Wave Analysis: Price Prediction and Trading Strategies for Forex Traders

Elliott Wave analysis for GBPAUD, covering the bullish trend, wave structure, and key support levels...

Read More >
British Pound/Japanese Yen(GBPJPY)  Forex Elliott Wave Technical Analysis: Technical levels and future market directions

British Pound/Japanese Yen(GBPJPY)  Forex Elliott Wave Technical Analysis: Technical levels and future market directions

This detailed analysis of GBPJPY using the Elliott Wave theory offers a deep dive into the correctiv...

Read More >
NextEra Energy Inc.(NEE) Stocks Elliott Wave Technical Analysis: Overview of Current trends in both the Daily and 1-hour Charts

NextEra Energy Inc.(NEE) Stocks Elliott Wave Technical Analysis: Overview of Current trends in both the Daily and 1-hour Charts

This Elliott Wave analysis of NextEra Energy Inc. (NEE) provides a detailed overview of current tren...

Read More >
Comprehensive Elliott Wave Analysis: S&P 500, NASDAQ, and Key Indices

Comprehensive Elliott Wave Analysis: S&P 500, NASDAQ, and Key Indices

This comprehensive analysis covers key stock market indices, including the S&P 500, NASDAQ 100, and ...

Read More >
THETAUSD Elliott Wave Technical Analysis: Theta/U.S. Dollar Pair Highlights Critical Support and Resistance Levels

THETAUSD Elliott Wave Technical Analysis: Theta/U.S. Dollar Pair Highlights Critical Support and Resistance Levels

This article provides an in-depth THETAUSD Elliott Wave analysis, covering the latest price trends, ...

Read More >
Optimize Your Asx Trading Strategies: RESMED INC - RMD Stock Analysis & Elliott Wave Technical Forecast

Optimize Your Asx Trading Strategies: RESMED INC - RMD Stock Analysis & Elliott Wave Technical Forecast

This article provides a comprehensive Elliott Wave analysis of ASX: ResMed Inc (RMD), offering insig...

Read More >

$1 for 2 Weeks

then $29 a month!

What a Special Offer!

Trade Recommendations

Unleash the power of deversified trading with our comprehensive portfolio, covering 250+ markets:

  • Stock Trades
  • Crypto Trades
  • Forex Trades
  • Commodity Trades
Elliott Wave Analysis

Gain a competitive edge with expert insights and AI-powered Elliott Wave charting into:

  • Global Indices
  • US Stocks & ASX Stocks
  • Forex & Crypto
  • Commodities
Top-Notch Trading Tools

Equip yourself with the tools of success:

  • Real-time Chat rooms
  • Elliott Wave Algorithm
  • Portfolio tools
  • TradingLevels
  • Screener
  • Trading Game
7 Elliott Wave Analysts

Stay ahead of the market with daily charts and insightful videos
Your secret to strategic trading!

JOIN HERE


Welcome to TradingLounge (ASIC A.R.No. 321187), specialists in trades, trading education and technical analysis, covering stocks, indices, commodities, forex and cryptocurrencies.

When you join TradingLounge you have access to everything we offer, including trade tools, educational content and a social platform to chat with like-minded investors.

Read more

@Copyright 2024 by tradinglounge.com

Contact Us

Australian no: 02 4787 6020

International no: +61 (2) 47876020

Pay with:

Find us on