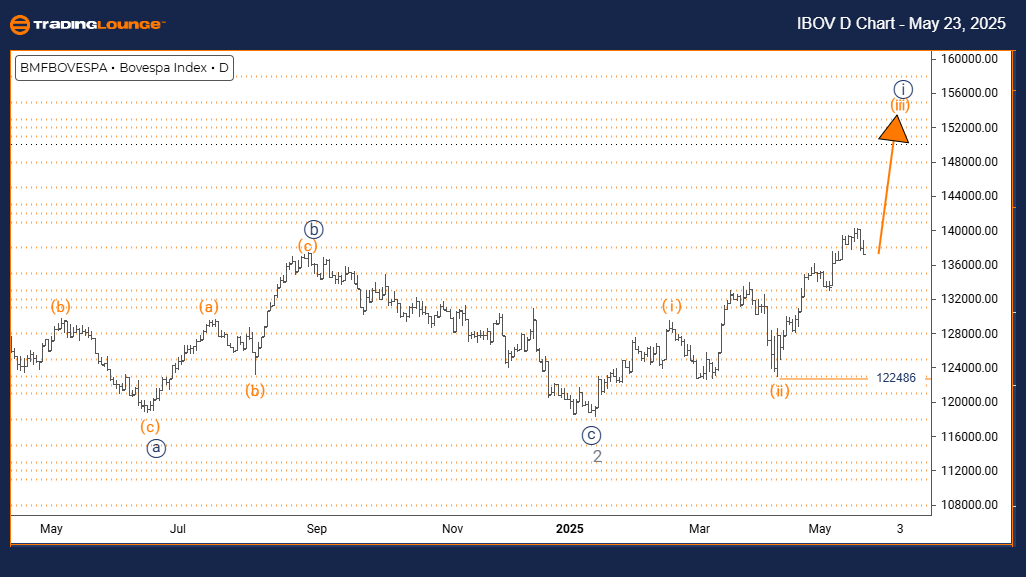
Bovespa Index Elliott Wave Analysis – Trading Lounge  Day Chart

Bovespa Index – Day Chart Analysis

Bovespa Index Elliott Wave Technical Analysis

FUNCTION: Bullish Trend

MODE: Impulsive

STRUCTURE: Orange Wave 3

POSITION: Navy Blue Wave 1

DIRECTION NEXT LOWER DEGREES: Orange Wave 4

DETAILS: Completion of Orange Wave 2 confirmed; Orange Wave 3 currently active

WAVE CANCEL INVALIDATION LEVEL: 122486

The daily chart of the Bovespa Index signals a robust bullish trend, positioning in Orange Wave 3 within the broader Navy Blue Wave 1 structure. The end of Orange Wave 2 has led to the initiation of a typically strong impulsive phase in the Elliott Wave forecast.

This stage indicates intense buying interest and reinforces the Brazil stock market’s bullish momentum. As long as the index stays above 122486, this bullish Elliott Wave interpretation remains valid. A drop below this level would require a reassessment of the current wave structure.

This analysis provides valuable insights for traders looking to capitalize on the Bovespa Index's upward trend. The following phase, Orange Wave 4, is expected to be corrective. Traders should observe the wave's progression and adjust strategies accordingly to manage risks effectively.

Bovespa-Index-Day-Ch...


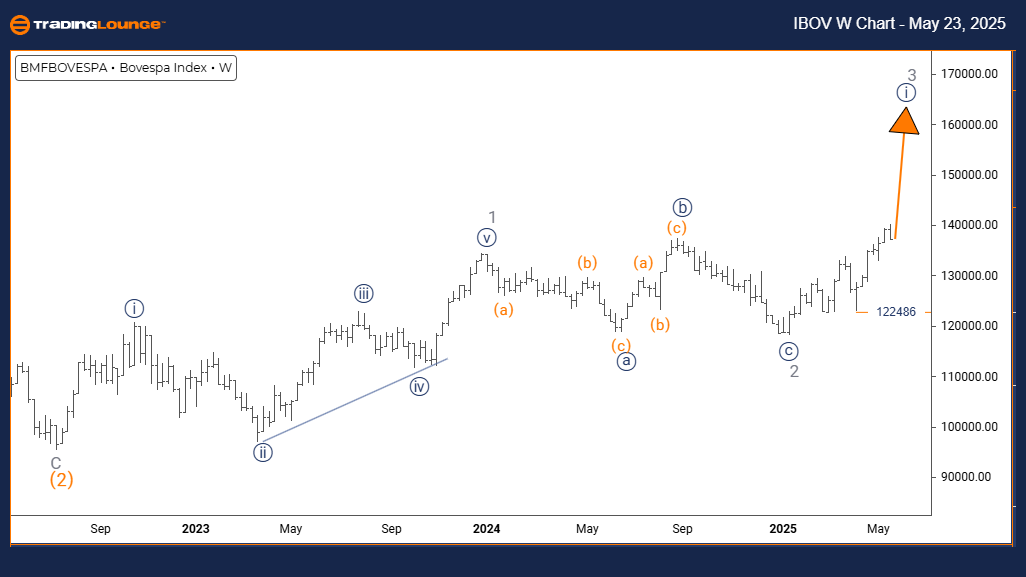
Bovespa Index Elliott Wave Analysis – TradingLounge Weekly Chart

Bovespa Index Elliott Wave Technical Analysis

FUNCTION: Bullish Trend

MODE: Impulsive

STRUCTURE: Navy Blue Wave 1

POSITION: Gray Wave 3

DIRECTION NEXT LOWER DEGREES: Navy Blue Wave 2

DETAILS: Gray Wave 2 confirmed complete; Navy Blue Wave 1 of 3 currently in progress

WAVE CANCEL INVALIDATION LEVEL: 122486

The weekly Bovespa Index chart continues to support a bullish Elliott Wave outlook. The structure identifies the development of Navy Blue Wave 1 within Gray Wave 3, following the confirmed end of Gray Wave 2.

This impulsive movement reflects a potential start to a significant long-term rally in the Brazilian equity market. The wave count remains valid as long as the price holds above 122486, supporting the current bullish perspective.

This broader wave structure suggests the Bovespa Index may be in the early stages of an extended upward cycle. Navy Blue Wave 2, anticipated to be corrective, is expected to follow. Investors should monitor for trend continuation signals and be ready to reassess if the critical support level is breached.

Technical Analyst: Malik Awais

Source: Visit Tradinglounge.com and learn from the Experts. Join TradingLounge Here 

Previous: CAC 40 (France) Index Elliott Wave Technical Analysis

VALUE Offer - Buy 1 Month & Get 3 Months!Click here

Access 7 Analysts Over 200 Markets Covered. Chat Room With Support

Bovespa-Index-Weekly...

Related

INSURANCE AUSTRALIA GROUP LIMITED (IAG) Elliott Wave Analysis: Price Levels & Market Trends for Smarter Trading Decisions

INSURANCE AUSTRALIA GROUP LIMITED (IAG) Elliott Wave Analysis: Price Levels & Market Trends for Smarter Trading Decisions

Elliott Wave technical analysis for ASX: IAG (Insurance Australia Group Limited) provides a detailed...

Read More >
Our Expert Forecasts and Financial news on NASDAQ Index Elliott Wave Technical Analysis

Our Expert Forecasts and Financial news on NASDAQ Index Elliott Wave Technical Analysis

Our comprehensive guide offers a detailed look into NASDAQ Composite trading, including Elliott Wave...

Read More >
JSW Steel Elliott Wave Analysis Confirms Orange Wave 3 Strength, Navy Blue Wave 1 Riding Uptrend, Watch Invalidation Level

JSW Steel Elliott Wave Analysis Confirms Orange Wave 3 Strength, Navy Blue Wave 1 Riding Uptrend, Watch Invalidation Level

The Elliott Wave analysis of JSW Steel reveals a strong bullish trend on both daily and weekly chart...

Read More >
Bitcoin Elliott Wave Technical Analysis: BTCUSD Charts, Trading Strategy, Bullish Momentum, and Price Prediction

Bitcoin Elliott Wave Technical Analysis: BTCUSD Charts, Trading Strategy, Bullish Momentum, and Price Prediction

Bitcoin Elliott Wave Analysis highlights BTCUSD technical charts for both daily and 4-hour timeframe...

Read More >
The Coca-Cola KO Stock Forecast: Elliott Wave Analysis Predicts Bullish Wave 3 Breakout Toward $100 Price Target with Strong Momentum

The Coca-Cola KO Stock Forecast: Elliott Wave Analysis Predicts Bullish Wave 3 Breakout Toward $100 Price Target with Strong Momentum

Elliott Wave analysis of Coca-Cola (KO) reveals a bullish setup on both the daily and hourly charts....

Read More >
 NASDAQ Stock Market Report: AAPL, TSLA, AMZN, NVDA, MSFT, Meta Platforms, NFLX, GOOGL

NASDAQ Stock Market Report: AAPL, TSLA, AMZN, NVDA, MSFT, Meta Platforms, NFLX, GOOGL

NASDAQ-listed stocks, including AAPL, TSLA, AMZN, NVDA, MSFT, Meta Platforms, NFLX, and GOOGL. The a...

Read More >

$1 for 2 Weeks

then $29 a month!

What a Special Offer!

Trade Recommendations

Unleash the power of deversified trading with our comprehensive portfolio, covering 250+ markets:

  • Stock Trades
  • Crypto Trades
  • Forex Trades
  • Commodity Trades
Elliott Wave Analysis

Gain a competitive edge with expert insights and AI-powered Elliott Wave charting into:

  • Global Indices
  • US Stocks & ASX Stocks
  • Forex & Crypto
  • Commodities
Top-Notch Trading Tools

Equip yourself with the tools of success:

  • Real-time Chat rooms
  • Elliott Wave Algorithm
  • Portfolio tools
  • TradingLevels
  • Screener
  • Trading Game
7 Elliott Wave Analysts

Stay ahead of the market with daily charts and insightful videos
Your secret to strategic trading!

JOIN HERE


Welcome to TradingLounge (ASIC A.R.No. 321187), specialists in trades, trading education and technical analysis, covering stocks, indices, commodities, forex and cryptocurrencies.

When you join TradingLounge you have access to everything we offer, including trade tools, educational content and a social platform to chat with like-minded investors.

Read more

@Copyright 2024 by tradinglounge.com

Contact Us

Australian no: 02 4787 6020

International no: +61 (2) 47876020

Pay with:

Find us on