20Nov

Understand how Elliott Wave Theory Applies to DIS Stock's Future Trajectory: The Walt Disney Co. Technical Analysis

Elliott Wave Analysis of The Walt Disney Co. (DIS)

In this Elliott Wave analysis, we’ll evaluate the trend structure of The Walt Disney Co. (DIS) using daily and 1-hour charts to determine the current wave position and potential price targets.


DIS Elliott Wave Analysis: TradingLounge Daily Chart

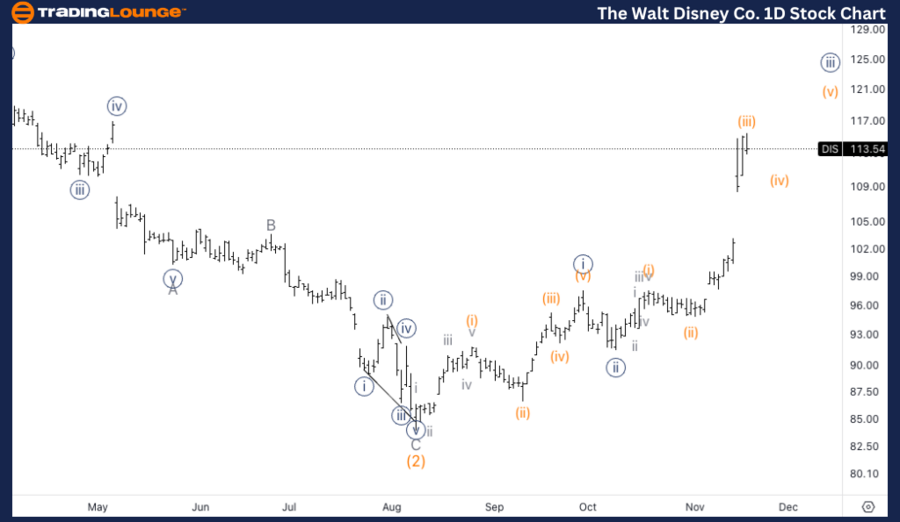
The Walt Disney Co. (DIS) Daily Chart

DIS Elliott Wave Technical Analysis

Function: Trend

Mode: Impulsive

Structure: Motive

Position: Wave {iii} of 1

Direction: Upside in wave 1

Details: The longer-term count poses challenges due to uncertainties about whether the extended correction is fully complete. With prices now trading above TradingLevel1 at $100, confidence in the bullish scenario is growing, suggesting a potential for further upward movement.

DIS Elliott Wave Technical Analysis – Daily Chart

On the daily chart, Disney (DIS) is advancing in wave {iii} of 1, part of a larger impulsive structure. The longer-term Elliott Wave count remains somewhat unclear due to the complex correction the stock has experienced. However, breaking above TradingLevel1 at $100 has strengthened the case for an upside breakout. This suggests the correction might have concluded, with DIS positioned for further gains in this impulsive structure.

The-Walt-Disney-Co-1...


DIS Elliott Wave Analysis: TradingLounge 1-Hour Chart

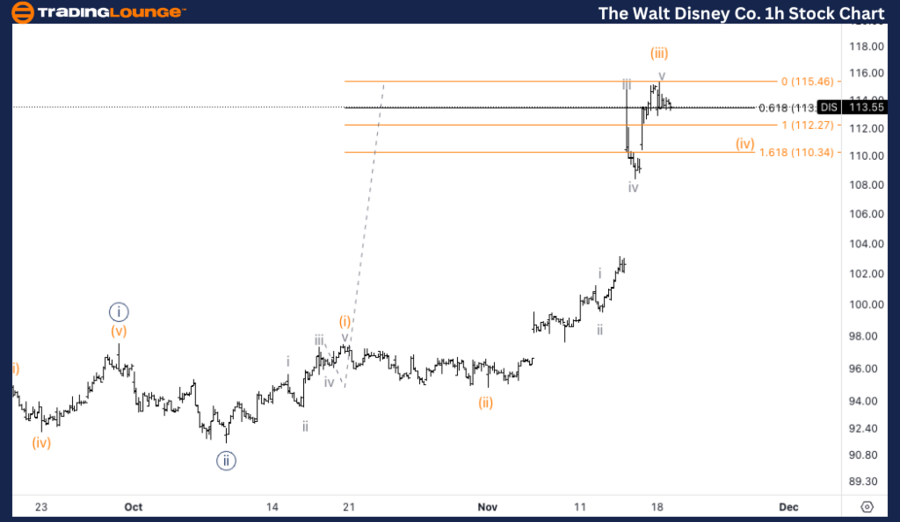
The Walt Disney Co. (DIS) 1H Chart

DIS Elliott Wave Technical Analysis

Function: Trend

Mode: Impulsive

Structure: Motive

Position: Wave (iii) of {iii}

Direction: Pullback in wave (iv)

Details: After a sharp rally, it appears wave (iii) of {iii} has reached a top. A corrective wave (iv) is now expected, which could find support near the previous wave iv of one lesser degree, as well as near equality with wave (2), around the $112 level.

DIS Elliott Wave Technical Analysis – 1H Chart

On the 1-hour chart, wave (iii) of {iii} appears to have peaked following a strong acceleration. The next anticipated move is a corrective wave (iv). This pullback is likely to find support near the prior wave iv of one lesser degree and around $112, aligning with equality to the earlier wave (2). This consolidation should set the stage for a final upward thrust in wave (v).

Technical Analyst: Alessio Barretta

Source: visit Tradinglounge.com and learn From the Experts Join TradingLounge Here 

See Previous: JP Morgan & Chase Co Elliott Wave Technical Analysis

VALUE Offer - Buy 1 Month & Get 3 Months!Click here

Access 7 Analysts Over 200 Markets Covered. Chat Room With Support

The-Walt-Disney-Co-1...

Related

Understand the key Signals and Patterns in Gold's Market Movement: Gold (XAUUSD) Commodity Elliott Wave Analysis

Understand the key Signals and Patterns in Gold's Market Movement: Gold (XAUUSD) Commodity Elliott Wave Analysis

This article provides a comprehensive Gold Elliott Wave analysis, covering gold price predictions, m...

Read More >
Comprehensive Analysis of the Swiss Market Index (SMI) delves into the Elliott Wave Technical Analysis: day and weekly charts

Comprehensive Analysis of the Swiss Market Index (SMI) delves into the Elliott Wave Technical Analysis: day and weekly charts

This comprehensive analysis of the Swiss Market Index (SMI) delves into the Elliott Wave patterns on...

Read More >
Bitcoin Elliott Wave Analysis: BTC/USD Price Forecast, Support & Resistance Levels, and Key Market Trends for Traders

Bitcoin Elliott Wave Analysis: BTC/USD Price Forecast, Support & Resistance Levels, and Key Market Trends for Traders

This Elliott Wave analysis of BTC/USD provides insights into Bitcoin’s current trend, price targets...

Read More >
U.S. Dollar / Japanese Yen Elliott Wave Technical Analysis: Perfect for Forex Traders Seeking Insights into USDJPY Price Movements

U.S. Dollar / Japanese Yen Elliott Wave Technical Analysis: Perfect for Forex Traders Seeking Insights into USDJPY Price Movements

Discover the latest USDJPY Elliott Wave analysis focusing on daily and 4-hour charts. This comprehen...

Read More >
Insights to Support Informed Trading Decisions: British Pound/U.S. Dollar (GBPUSD) Forex Elliott Wave Technical Analysis

Insights to Support Informed Trading Decisions: British Pound/U.S. Dollar (GBPUSD) Forex Elliott Wave Technical Analysis

This article provides a thorough Elliott Wave analysis for GBPUSD, covering both daily and 4-hour ch...

Read More >
AUDUSD Elliott Wave Analysis: Impulsive Wave 1 Signals New Trend with Key Support at 0.59150 and Entry Opportunity Ahead

AUDUSD Elliott Wave Analysis: Impulsive Wave 1 Signals New Trend with Key Support at 0.59150 and Entry Opportunity Ahead

AUDUSD forms orange wave 1 in a new impulsive trend, presenting potential retracement and long-entry...

Read More >

$1 for 2 Weeks

then $29 a month!

What a Special Offer!

Trade Recommendations

Unleash the power of deversified trading with our comprehensive portfolio, covering 250+ markets:

  • Stock Trades
  • Crypto Trades
  • Forex Trades
  • Commodity Trades
Elliott Wave Analysis

Gain a competitive edge with expert insights and AI-powered Elliott Wave charting into:

  • Global Indices
  • US Stocks & ASX Stocks
  • Forex & Crypto
  • Commodities
Top-Notch Trading Tools

Equip yourself with the tools of success:

  • Real-time Chat rooms
  • Elliott Wave Algorithm
  • Portfolio tools
  • TradingLevels
  • Screener
  • Trading Game
7 Elliott Wave Analysts

Stay ahead of the market with daily charts and insightful videos
Your secret to strategic trading!

JOIN HERE


Welcome to TradingLounge (ASIC A.R.No. 321187), specialists in trades, trading education and technical analysis, covering stocks, indices, commodities, forex and cryptocurrencies.

When you join TradingLounge you have access to everything we offer, including trade tools, educational content and a social platform to chat with like-minded investors.

Read more

@Copyright 2024 by tradinglounge.com

Contact Us

Australian no: 02 4787 6020

International no: +61 (2) 47876020

Pay with:

Find us on