10Mar

Dogecoin (DOGEUSD) Elliott Wave Technical Analysis – Price Prediction, Trading Strategy, Support & Resistance Levels

Dogecoin (DOGEUSD) Elliott Wave Analysis – Daily Charts 

DOGEUSD Elliott Wave Technical Analysis

Function: Counter-Trend

Mode: Corrective

Structure: Flat

Position: Wave C

Next Higher Degree Direction: Wave (III) of Impulse

Wave Cancellation Level: Not specified

Details: The ongoing correction in Wave C is still unfolding, indicating that the market is preparing for a potential reversal. Traders should wait for confirmation before anticipating an uptrend resumption.

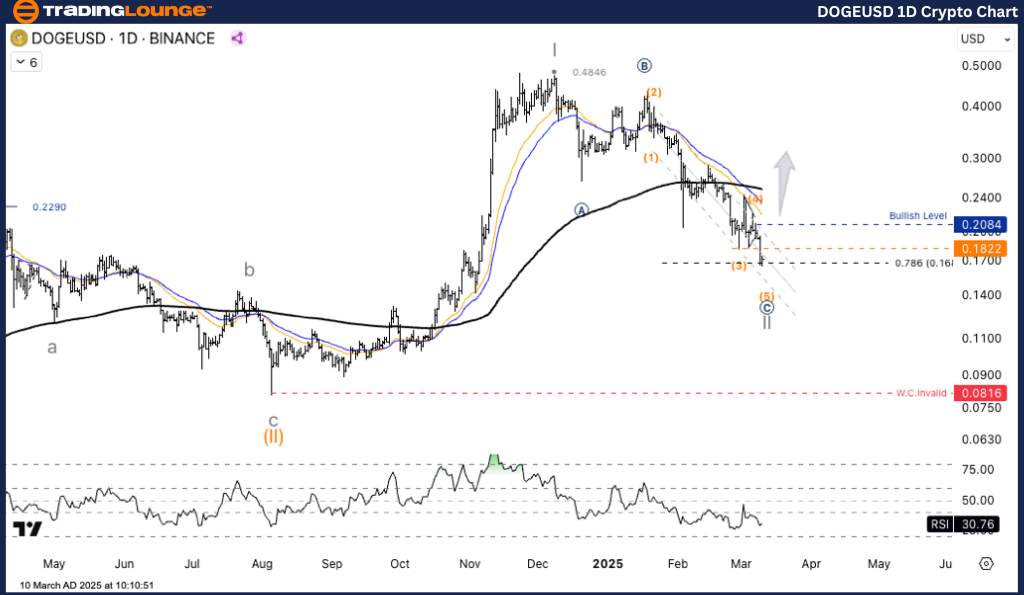
Dogecoin (DOGEUSD) Trading Strategy – Daily Chart

DOGE/USD has been in a consistent downtrend from its 0.4846 USD peak, now progressing through the final phase of Wave C in the WXY corrective pattern. Currently, Wave (5) is forming in the ongoing bearish movement.

Trading Strategies – Daily Chart

Long Strategy

Buy at Key Support Levels:

  • Short-Term Buy Opportunity: A potential entry can be considered if the price bounces from 0.1822 USD, especially if the RSI signals a recovery from oversold conditions.

Risk Management

  • Invalidation Level: If DOGE/USD drops below 0.0816 USD, the bullish structure will be considered invalid.

DOGEUSD-1d-crypto-ch...


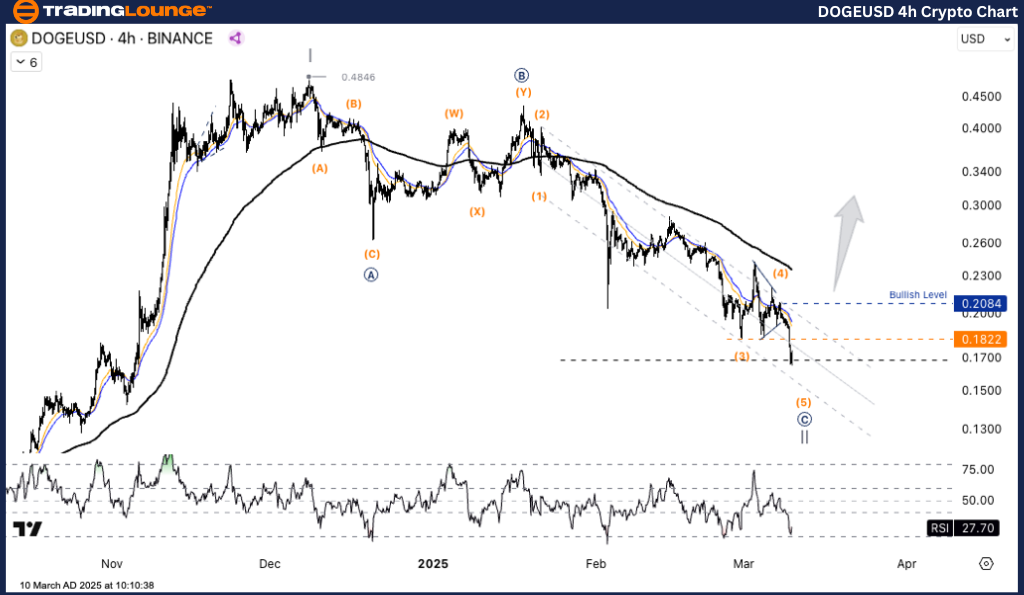
Dogecoin (DOGEUSD) Elliott Wave Analysis – H4 Chart 

DOGEUSD Elliott Wave Technical Analysis 

Function: Counter-Trend

Mode: Corrective

Structure: Flat

Position: Wave C

Next Higher Degree Direction: Wave (III) of Impulse

Wave Cancellation Level: Not specified

Details: Wave C is still unfolding, and the market remains in a corrective phase before any potential bullish reversal. Traders should wait for confirmation of a shift before taking positions.

Dogecoin (DOGEUSD) Trading Strategy – H4 Chart

The price action remains bearish, with DOGE/USD moving lower from its 0.4846 USD high, now progressing through Wave C of the WXY pattern. The current wave structure suggests that Wave (5) is developing in the ongoing correction.

Trading Strategies – H4 Chart

Long Strategy

Buy at Key Support Levels:

  • Short-Term Buy Opportunity: A possible entry exists if the price rebounds near 0.1822 USD, supported by an RSI recovery from the oversold zone.

Risk Management

  • Invalidation Level: A drop below 0.0816 USD invalidates the bullish outlook.

Technical Analyst: Kittiampon Somboonsod

Source: visit Tradinglounge.com and learn From the Experts Join TradingLounge Here 

Previous: BTCUSD Elliott Wave Technical Analysis

VALUE Offer - Buy 1 Month & Get 3 Months!Click here

Access 7 Analysts Over 200 Markets Covered. Chat Room With Support

DOGEUSD-4h-crypto-ch...

Related

Expert Insights on INDIA Index Market Trading Strategies for Maximizing Returns: NIFTY 50 Index Elliott Wave Technical Analysis

Expert Insights on INDIA Index Market Trading Strategies for Maximizing Returns: NIFTY 50 Index Elliott Wave Technical Analysis

Stay ahead in the market with the latest NIFTY 50 analysis based on Elliott Wave Theory. This report...

Read More >
Learn effective forex trading strategies: Euro/U.S.Dollar(EURUSD) Forex Elliott Wave Technical Analysis

Learn effective forex trading strategies: Euro/U.S.Dollar(EURUSD) Forex Elliott Wave Technical Analysis

Our detailed EURUSD Elliott Wave Analysis provides essential insights for traders, using Elliott Wav...

Read More >
Australian Dollar/U.S. Dollar (AUDJPY) Elliott Wave Forecast Highlights Impulsive Corrections and Trading Opportunities

Australian Dollar/U.S. Dollar (AUDJPY) Elliott Wave Forecast Highlights Impulsive Corrections and Trading Opportunities

AUDJPY Elliott Wave analysis explores the current impulsive correction on both daily and 4-hour char...

Read More >
Current Market Trends and Potential Movements in Bitcoin’s Price to Enhance Strategy: BTCUSD Elliott Wave Technical Analysis

Current Market Trends and Potential Movements in Bitcoin’s Price to Enhance Strategy: BTCUSD Elliott Wave Technical Analysis

This analysis offers a detailed BTCUSD Elliott Wave forecast, providing Bitcoin price predictions, t...

Read More >
State Bank of India stock analysis using Elliott Wave forecast reveals bullish trend, share price movement, and market outlook.

State Bank of India stock analysis using Elliott Wave forecast reveals bullish trend, share price movement, and market outlook.

State Bank of India (SBI) through the lens of Elliott Wave Theory. It highlights the current bullish...

Read More >
Unlocking ASX Trading Success: NEWMONT CORPORATION – NEM Stock Analysis & Elliott Wave Technical Forecast

Unlocking ASX Trading Success: NEWMONT CORPORATION – NEM Stock Analysis & Elliott Wave Technical Forecast

Dive into our comprehensive Elliott Wave analysis for NEWMONT CORPORATION (NEM) on the Australian St...

Read More >

$1 for 2 Weeks

then $29 a month!

What a Special Offer!

Trade Recommendations

Unleash the power of deversified trading with our comprehensive portfolio, covering 250+ markets:

  • Stock Trades
  • Crypto Trades
  • Forex Trades
  • Commodity Trades
Elliott Wave Analysis

Gain a competitive edge with expert insights and AI-powered Elliott Wave charting into:

  • Global Indices
  • US Stocks & ASX Stocks
  • Forex & Crypto
  • Commodities
Top-Notch Trading Tools

Equip yourself with the tools of success:

  • Real-time Chat rooms
  • Elliott Wave Algorithm
  • Portfolio tools
  • TradingLevels
  • Screener
  • Trading Game
7 Elliott Wave Analysts

Stay ahead of the market with daily charts and insightful videos
Your secret to strategic trading!

JOIN HERE


Welcome to TradingLounge (ASIC A.R.No. 321187), specialists in trades, trading education and technical analysis, covering stocks, indices, commodities, forex and cryptocurrencies.

When you join TradingLounge you have access to everything we offer, including trade tools, educational content and a social platform to chat with like-minded investors.

Read more

@Copyright 2024 by tradinglounge.com

Contact Us

Australian no: 02 4787 6020

International no: +61 (2) 47876020

Pay with:

Find us on