01Jul

Australian Dollar/U.S. Dollar (AUDJPY) Elliott Wave Forecast Highlights Impulsive Corrections and Trading Opportunities

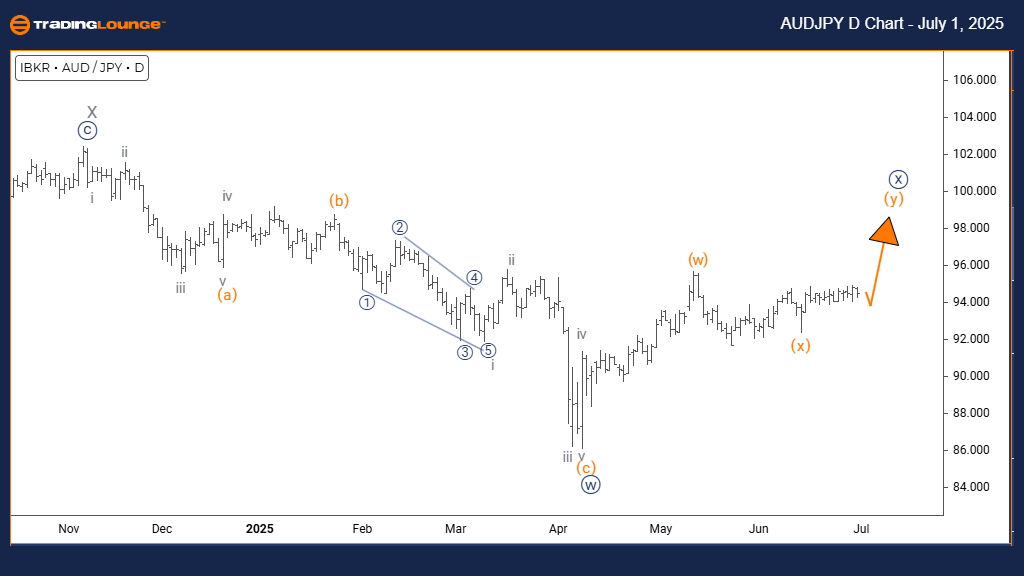
AUDJPY Elliott Wave Analysis – TradingLounge Daily Chart

AUDJPY Elliott Wave Technical Overview

Function: Counter-Trend

Mode: Impulsive

Structure: Navy Blue Wave X

Position: Gray Wave Y

Direction (Lower Degrees): Navy Blue Wave Y

Details: Completion seen in Navy Blue Wave W; Navy Blue Wave X is now underway.

Daily Chart Summary
The AUDJPY Elliott Wave forecast on the daily timeframe highlights a counter-trend formation. The current movement is impulsive, pushing opposite the prevailing trend. The present wave is labeled as Navy Blue Wave X, part of a larger corrective pattern within Gray Wave Y. This indicates a potential continuation or evolution of the corrective structure.

Wave W to X Transition
With Navy Blue Wave W finalized, the pair has initiated Navy Blue Wave X. Typically part of a complex correction, this wave may evolve into a combination structure. Following this, Navy Blue Wave Y is expected to emerge once Wave X completes.

Technical Outlook
From an AUDJPY technical analysis standpoint, the pair is within a corrective phase. Wave X's impulsive character suggests strong price movement. Nonetheless, this is still corrective action and not the beginning of a new bullish or bearish trend.

AUDJPY-d-chart-01072...


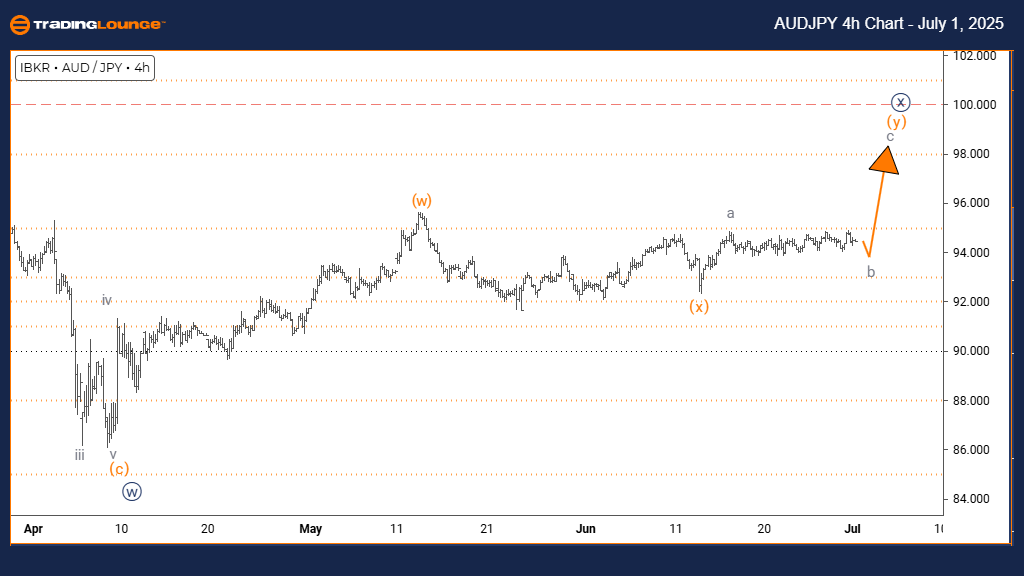
AUDJPY Elliott Wave Analysis – TradingLounge 4-Hour Chart

AUDJPY Elliott Wave Technical Overview

Function: Counter-Trend

Mode: Impulsive

Structure: Orange Wave Y

Position: Navy Blue Wave X

Direction (Higher Degrees): Orange Wave Y (Continuing)

Details: Orange Wave X appears to have ended; Orange Wave Y is now developing.

4-Hour Chart Summary
On the 4-hour chart, the AUDJPY Elliott Wave analysis also reflects a counter-trend scenario. Price action remains impulsive and moves strongly against the dominant trend. The current structure is Orange Wave Y, which forms part of the broader Navy Blue Wave X correction. This setup points toward an extended corrective leg.

Wave x to Y Shift
With Orange Wave x now complete, the focus turns to the ongoing development of Orange Wave Y within the larger Wave X. This segment often forms into recognizable structures such as zigzags or combinations.

Technical Outlook
The Forex trading signals derived from the structure indicate that AUDJPY remains in a counter-trend correction with Orange Wave Y active. Post-Wave x momentum appears strong, yet it's still within a corrective context—not signaling a trend change. Caution is advised while observing upcoming moves in the pattern.

Technical Analyst: Malik Awais

Source: Visit Tradinglounge.com and learn from the Experts. Join TradingLounge Here

Previous: GBPJPY Elliott Wave Technical Analysis

VALUE Offer - $1 for 2 Weeks then $29 a month!Click here

Access 7 Analysts Over 200 Markets Covered. Chat Room With Support

AUDJPY-4h-chart-0107...

Related

Insightful Day and 4-Hour Chart Review: British Pound/Japanese Yen(GBPJPY) Forex Elliott Wave Technical Analysis

Insightful Day and 4-Hour Chart Review: British Pound/Japanese Yen(GBPJPY) Forex Elliott Wave Technical Analysis

This comprehensive guide offers detailed GBPJPY trading analysis, focusing on Elliott Wave forecasts...

Read More >
AAVE / U.S. dollar(AAVEUSD) Elliott Wave Technical Analysis 18 January 24

AAVE / U.S. dollar(AAVEUSD) Elliott Wave Technical Analysis 18 January 24

AAVE/U.S. dollar(AAVEUSD) Elliott Wave Technical Analysis dated 18 January 24, Our AAVE/U.S. dollar(...

Read More >
Amazon Inc Stock Forecast: AMZN Elliott Wave Analysis Forecasts Wave (v) Upside Near $230 — Daily & Intraday Technical Insights

Amazon Inc Stock Forecast: AMZN Elliott Wave Analysis Forecasts Wave (v) Upside Near $230 — Daily & Intraday Technical Insights

In this AMZN Elliott Wave analysis, we explore motive wave (v) unfolding on both daily and 1‑hour c...

Read More >
Bitcoin/U.S. dollar(BTCUSD) Elliott Wave Technical Analysis 17 October 23

Bitcoin/U.S. dollar(BTCUSD) Elliott Wave Technical Analysis 17 October 23

Trading lounge Bitcoin/U.S. dollar(BTCUSD) Elliott Wave Technical Analysis 4-hour and day charts for...

Read More >
Commodities & Futures Market Analysis: Elliott Wave Insights & Strategies

Commodities & Futures Market Analysis: Elliott Wave Insights & Strategies

Discover profitable opportunities in the Commodities and Futures Trading Market with our comprehen...

Read More >
Effective trading strategies and technical analysis: British Pound/U.S.Dollar(GBPUSD) Forex Elliott Wave Technical Analysis

Effective trading strategies and technical analysis: British Pound/U.S.Dollar(GBPUSD) Forex Elliott Wave Technical Analysis

This detailed analysis of GBP/USD using Elliott Wave Theory provides key insights into the current m...

Read More >

$1 for 2 Weeks

then $29 a month!

What a Special Offer!

Trade Recommendations

Unleash the power of deversified trading with our comprehensive portfolio, covering 250+ markets:

  • Stock Trades
  • Crypto Trades
  • Forex Trades
  • Commodity Trades
Elliott Wave Analysis

Gain a competitive edge with expert insights and AI-powered Elliott Wave charting into:

  • Global Indices
  • US Stocks & ASX Stocks
  • Forex & Crypto
  • Commodities
Top-Notch Trading Tools

Equip yourself with the tools of success:

  • Real-time Chat rooms
  • Elliott Wave Algorithm
  • Portfolio tools
  • TradingLevels
  • Screener
  • Trading Game
7 Elliott Wave Analysts

Stay ahead of the market with daily charts and insightful videos
Your secret to strategic trading!

JOIN HERE


Welcome to TradingLounge (ASIC A.R.No. 321187), specialists in trades, trading education and technical analysis, covering stocks, indices, commodities, forex and cryptocurrencies.

When you join TradingLounge you have access to everything we offer, including trade tools, educational content and a social platform to chat with like-minded investors.

Read more

@Copyright 2024 by tradinglounge.com

Contact Us

Australian no: 02 4787 6020

International no: +61 (2) 47876020

Pay with:

Find us on