NEE Elliott Wave Analysis: NextEra Energy Inc. (NEE) Daily and 1-Hour Chart Structures
This Elliott Wave analysis of NextEra Energy Inc. (NEE) highlights the current trends and potential future price movements based on both daily and 1-hour chart structures.
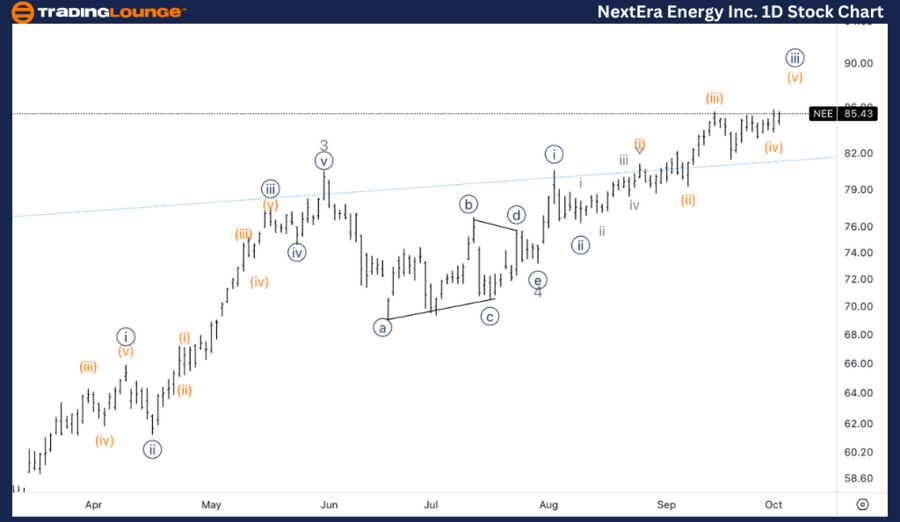
NEE Elliott Wave Analysis - Trading Lounge Daily Chart
NextEra Energy Inc. (NEE) Daily Chart
NEE Elliott Wave Technical Analysis
Function: Trend
Mode: Impulsive
Structure: Motive
Position: Wave 5
Direction: Upside in {iii} of 5
We are currently observing the potential for further upside in Wave 5, with an estimated target around $100, as the stock is now trading above the key level of $80 (TradingLevel8).
NEE Stock Technical Analysis – Daily Chart
On the daily chart, NextEra Energy (NEE) is progressing within an impulsive motive wave, particularly in Wave 5. The stock is trending upward within Wave {iii} of 5, and with the current price exceeding TradingLevel8 at $80, the next upside target for Wave 5 is approximately $100.
This price level is significant, as the stock has demonstrated strong bullish momentum, successfully surpassing key resistance points. Traders should monitor for continued upward movement, particularly as the price approaches the psychological level of $100.

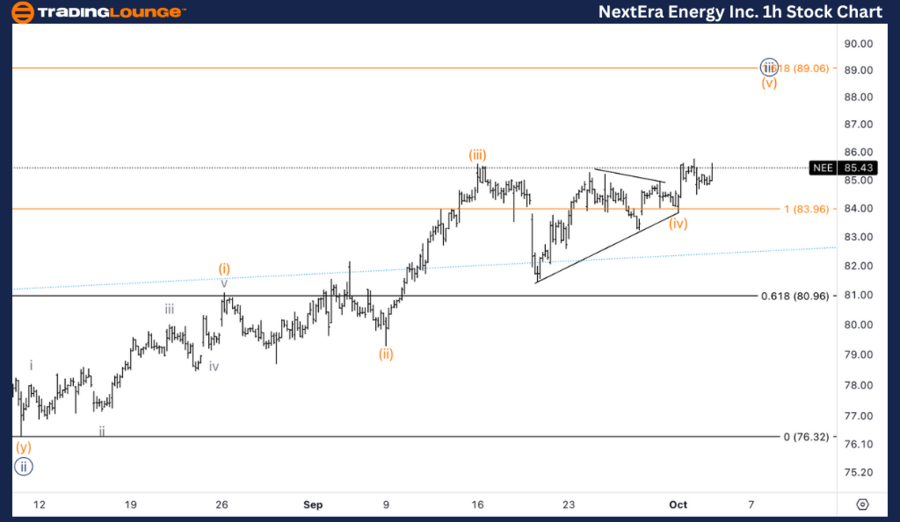
NextEra Energy Inc. (NEE) 1-Hour Chart Analysis
NEE Elliott Wave Technical Analysis
Function: Trend
Mode: Impulsive
Structure: Motive
Position: Wave (v) of {iii}
Direction: Upside in Wave (v)
We are looking for upside potential in Wave (v), following the breakout from a triangle pattern in Wave (iv). The 1.618 Fibonacci extension of {iii} vs. {i} is positioned around $89, presenting a possible upside target. Additionally, $88 could be seen as a profit-taking level due to its proximity to the Fibonacci target.
NEE Technical Analysis – 1-Hour Chart
On the 1-hour chart, NEE is in the final stages of Wave (v) of {iii}, having recently broken out of the triangle pattern formed during Wave (iv). The next target for Wave (v) is around $89, which aligns with the 1.618 Fibonacci extension of {iii} vs. {i}. Furthermore, the $88 level may serve as a potential profit-taking point due to its closeness to the Fibonacci extension target.
With the triangle breakout and ongoing upside momentum, NEE is expected to experience further gains in the short term, especially as it approaches $89, the next key resistance level.
Technical Analyst: Alessio Barretta
Source: visit Tradinglounge.com and learn From the Experts Join TradingLounge Here
See Previous: Caterpillar Inc. (CAT) Elliott Wave Technical Analysis
VALUE Offer - Buy 1 Month & Get 3 Months!Click here
Access 7 Analysts Over 200 Markets Covered. Chat Room With Support
