CAT Elliott Wave Analysis – Current Trend Structure of Caterpillar Inc. (CAT)

This analysis delves into the latest trend structure of Caterpillar Inc. (CAT) using Elliott Wave Theory, applied to both the daily and 1-hour charts. Below is a detailed breakdown of the stock's position and potential future movements.

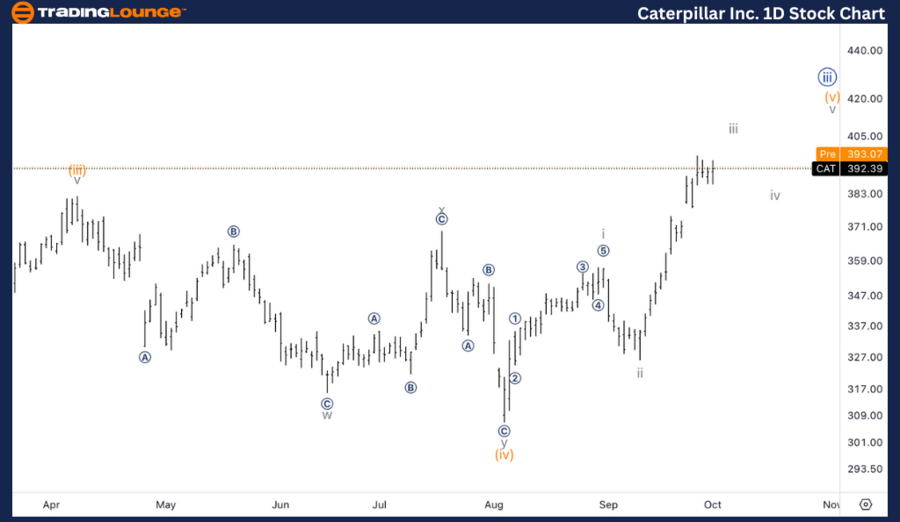
CAT Elliott Wave Analysis – TradingLounge Daily Chart

Caterpillar Inc. (CAT) Daily Chart Technical Analysis

CAT Elliott Wave Technical Analysis

FUNCTION: Trend

MODE: Impulsive

STRUCTURE: Motive

POSITION: Minute {iii}

DIRECTION: Upside into wave (v) of {iii}

DETAILS: The stock is expected to continue moving higher within Wave {iii}, with the potential to eventually reach $500.

CAT Stock Technical Analysis – Daily Chart Overview

On the daily chart, Caterpillar Inc. is advancing within an impulsive motive structure in Minute Wave {iii}. The stock is progressing upward and is currently within Wave (v) of {iii}. This indicates further upside potential, with $500 being the projected target for the completion of Wave {iii}.

Caterpillar is showing strong bullish momentum. Traders should watch for continued upward movement, especially as the stock approaches key resistance levels.

Caterpillar-Inc-1D-S...


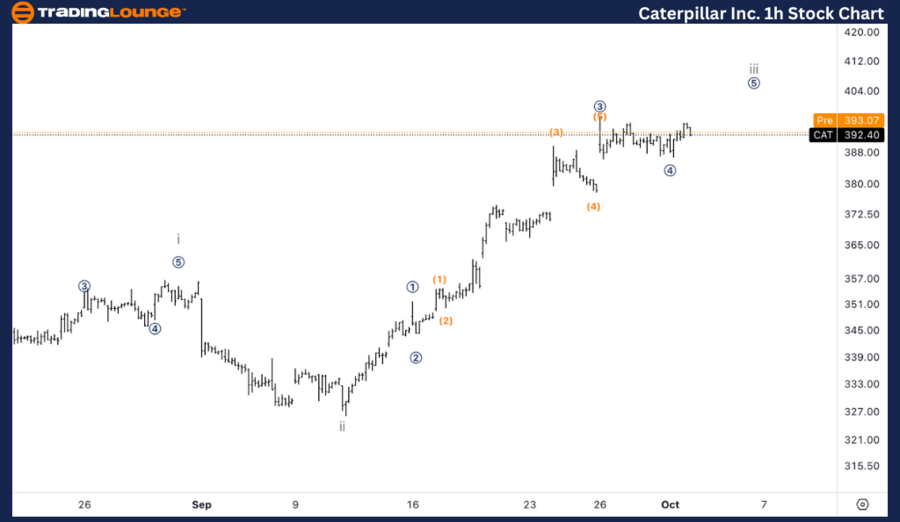
Caterpillar Inc. Elliott Wave Analysis – TradingLounge 1H Chart

Caterpillar Inc. (CAT) 1H Chart

CAT Elliott Wave Technical Analysis

FUNCTION: Trend

MODE: Impulsive

STRUCTURE: Motive

POSITION: Wave iii

DIRECTION: Micro wave 5 of iii

DETAILS: Expecting at least one more leg higher within Wave iii, as the stock has been correcting in Micro Wave 4 and is now resuming upward toward $400.

Caterpillar Inc. Elliott Wave Technical Analysis – 1H Chart Overview

On the 1-hour chart, Caterpillar appears to be advancing within Wave iii, specifically in Micro Wave 5 of iii. After completing a correction in Micro Wave 4, the stock is now resuming its upward trend, with the next upside target projected around $400.

This final leg of Wave iii suggests at least one more push higher before a possible corrective phase begins. Traders should keep an eye on the resistance near $400, as it may lead to some short-term consolidation before further upward movement.

Technical Analyst: Alessio Barretta

Source: visit Tradinglounge.com and learn From the Experts Join TradingLounge Here 

See Previous: Fortinet Inc. (FTNT) Elliott Wave Technical Analysis

VALUE Offer - Buy 1 Month & Get 3 Months!Click here

Access 7 Analysts Over 200 Markets Covered. Chat Room With Support

Caterpillar-Inc-1h-S...

Related

Comprehensive Australian Dollar/U.S.Dollar (AUDUSD) Elliott Wave Technical Analysis for strategic trading decisions

Comprehensive Australian Dollar/U.S.Dollar (AUDUSD) Elliott Wave Technical Analysis for strategic trading decisions

Explore detailed Elliott Wave Technical analysis for AUDUSD on both daily and 4-hour charts dated F...

Read More >
Lululemon athletica Inc. (LULU) Stock Forecast: Elliott Wave Technical Analysis, Resistance Levels, and Investment Strategies

Lululemon athletica Inc. (LULU) Stock Forecast: Elliott Wave Technical Analysis, Resistance Levels, and Investment Strategies

Lululemon (LULU) stock provides a detailed Elliott Wave forecast, highlighting key technical pattern...

Read More >
JP Morgan Chase & Co.(JPM:NYSE) Elliott Wave Technical Analysis Chart 13 October 23

JP Morgan Chase & Co.(JPM:NYSE) Elliott Wave Technical Analysis Chart 13 October 23

Trading Lounge Elliott Wave Technical Analysis Chart of JPM Stock for 13 October 23.

Read More >
Highlighting potential future movements ASX Stock: REA GROUP LTD – REA Stock Analysis & Elliott Wave Technical Forecast

Highlighting potential future movements ASX Stock: REA GROUP LTD – REA Stock Analysis & Elliott Wave Technical Forecast

This article provides an in-depth Elliott Wave analysis of REA Group Ltd, listed on the ASX. We expl...

Read More >
Commodity Market Report  Elliott Wave Analysis

Commodity Market Report Elliott Wave Analysis

Commodities | Latest News & Elliott Wave Analysis: US Bond Yields, Forex USDJPY, EURUSD, GBPUSD, AUD...

Read More >

$1 for 2 Weeks

then $29 a month!

What a Special Offer!

Trade Recommendations

Unleash the power of deversified trading with our comprehensive portfolio, covering 250+ markets:

  • Stock Trades
  • Crypto Trades
  • Forex Trades
  • Commodity Trades
Elliott Wave Analysis

Gain a competitive edge with expert insights and AI-powered Elliott Wave charting into:

  • Global Indices
  • US Stocks & ASX Stocks
  • Forex & Crypto
  • Commodities
Top-Notch Trading Tools

Equip yourself with the tools of success:

  • Real-time Chat rooms
  • Elliott Wave Algorithm
  • Portfolio tools
  • TradingLevels
  • Screener
  • Trading Game
7 Elliott Wave Analysts

Stay ahead of the market with daily charts and insightful videos
Your secret to strategic trading!

JOIN HERE


Welcome to TradingLounge (ASIC A.R.No. 321187), specialists in trades, trading education and technical analysis, covering stocks, indices, commodities, forex and cryptocurrencies.

When you join TradingLounge you have access to everything we offer, including trade tools, educational content and a social platform to chat with like-minded investors.

Read more

@Copyright 2024 by tradinglounge.com

Contact Us

Australian no: 02 4787 6020

International no: +61 (2) 47876020

Pay with:

Find us on