Euro Stoxx 50 Elliott Wave Analysis – Trading Lounge Daily Chart
Euro Stoxx 50 Elliott Wave Technical Analysis
- Function: Bullish Trend
- Mode: Impulsive
- Structure: Gray Wave 3
- Position: Orange Wave 3
- Direction Next Lower Degrees: Gray Wave 4
- Details: Gray Wave 2 appears completed; Gray Wave 3 of Orange Wave 3 is now in play.
- Wave Cancellation Invalid Level: 4,829
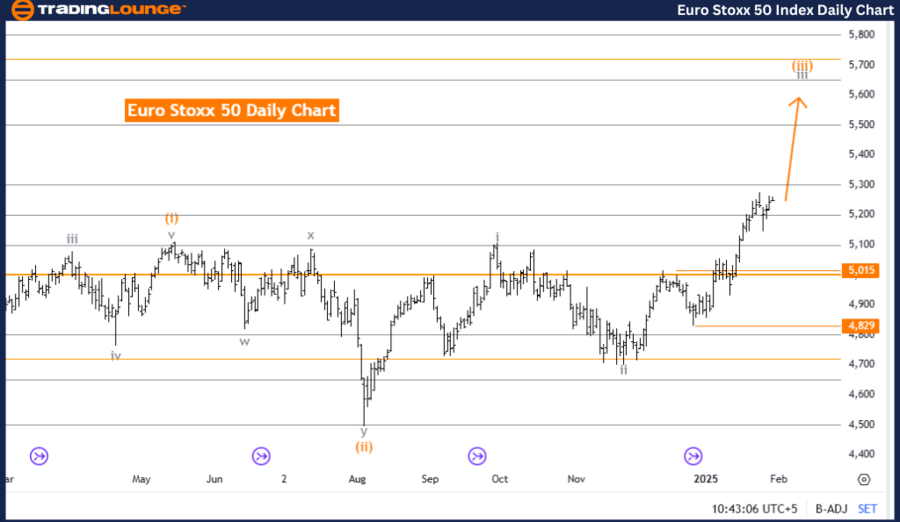
The Euro Stoxx 50 Elliott Wave Analysis on the daily chart highlights a strong bullish trend, supported by an impulsive wave structure. The market currently follows Gray Wave 3, which is part of the broader Orange Wave 3 cycle, reinforcing the ongoing upward momentum.
With Gray Wave 2 now completed, the market is advancing through Gray Wave 3 of Orange Wave 3, indicating the potential for further bullish movement. The next expected phase at a lower degree is Gray Wave 4, which typically introduces a corrective pullback following the completion of an impulsive wave.
Traders should closely monitor the progress of Gray Wave 3, as its completion will likely initiate Gray Wave 4, providing key insights into potential price corrections. A wave cancellation level is set at 4,829, meaning a price drop below this threshold would invalidate the current wave count, requiring a reassessment of the Elliott Wave structure.
Summary
✅ The Euro Stoxx 50 remains in an impulsive bullish phase, identified as Gray Wave 3 within Orange Wave 3.
✅ The completion of Gray Wave 2 has triggered continued upward momentum in Gray Wave 3.
✅ Traders should track Gray Wave 3 progression and observe the invalidation level at 4,829 to confirm the Elliott Wave structure.
✅ This analysis provides a structured framework for understanding the market’s current position and predicting future price movements within the broader bullish trend.
Euro Stoxx 50 Elliott Wave Analysis – Trading Lounge Weekly Chart
Euro Stoxx 50 Elliott Wave Technical Analysis
- Function: Bullish Trend
- Mode: Impulsive
- Structure: Orange Wave 3
- Position: Navy Blue Wave 3
- Direction Next Lower Degrees: Orange Wave 4
- Details: Orange Wave 2 appears completed; Orange Wave 3 of 3 is now in play.
- Wave Cancellation Invalid Level: 4,829
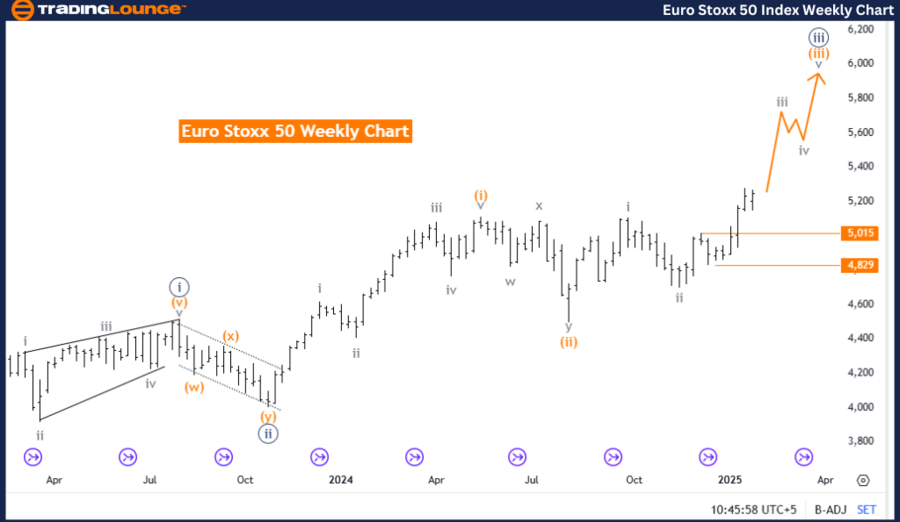
The Euro Stoxx 50 Elliott Wave Analysis on the weekly chart presents a broader technical perspective on the index’s bullish trend. The market mode remains impulsive, suggesting strong sustained upside potential.
The wave structure is identified as Orange Wave 3, which forms part of the larger Navy Blue Wave 3. This indicates that the market is in a high-degree bullish trend, reinforcing the continuation of upward momentum.
Following the completion of Orange Wave 2, the market has entered Orange Wave 3 of 3, which signals further strong upside movement. The next anticipated phase at a lower degree is Orange Wave 4, a corrective wave that typically follows an impulsive phase.
Traders should carefully track Orange Wave 3’s development, as its completion will mark the start of Orange Wave 4, providing insight into potential retracements and corrections. The wave cancellation invalidation level is set at 4,829—if the price falls below this mark, the current wave count becomes invalid, requiring a revised analysis of the Elliott Wave structure.
Summary
✅ The Euro Stoxx 50 remains in an impulsive bullish trend, currently in Orange Wave 3 within Navy Blue Wave 3.
✅ The completion of Orange Wave 2 has enabled the continuation of Orange Wave 3 of 3, supporting further upside potential.
✅ Traders should monitor Orange Wave 3 progression and keep an eye on the invalidation level at 4,829 to verify the Elliott Wave count.
✅ This analysis provides a structured approach to understanding current market positioning and anticipating future movements within the broader bullish cycle.
Technical Analyst: Malik Awais
Source: visit Tradinglounge.com and learn From the Experts Join TradingLounge Here
Previous: NIFTY 50 INDEX Elliott Wave Technical Analysis
VALUE Offer - Buy 1 Month & Get 3 Months!Click here
Access 7 Analysts Over 200 Markets Covered. Chat Room With Support