NIFTY 50 INDEX Elliott Wave Analysis - TradingLounge 1D Chart
NIFTY 50 INDEX – NIFTY Elliott Wave Technical Analysis (1D Chart)
Function: Counter Trend (Minor degree, Grey.)
Mode: Corrective
Structure: Impulse within a larger degree
Position: Minute Wave ((ii))
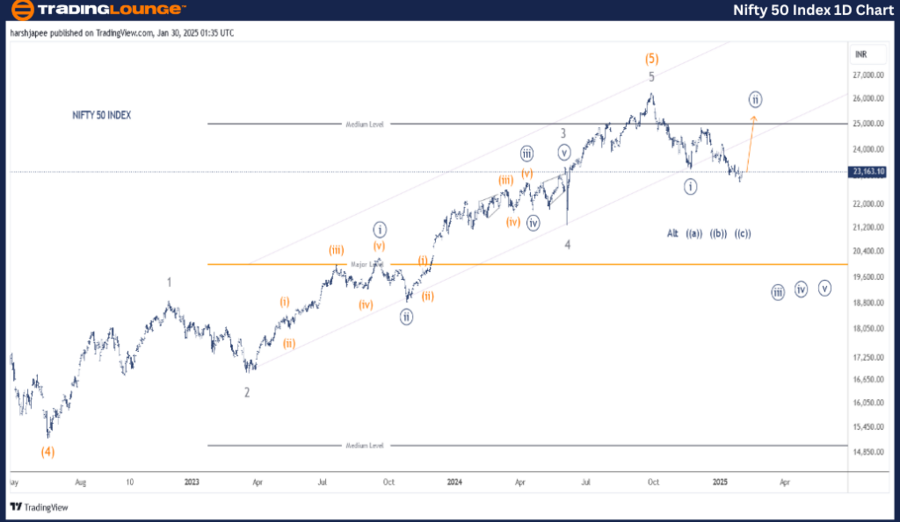
Details: Minute Wave ((ii)) is potentially progressing towards the 25,000 range before the downtrend resumes. The corrective wave is forming an expanded flat pattern. If this wave structure is accurate, a rally could be on the horizon soon. Alternatively, the entire pattern from the 26,300 high may be unfolding as a Minute degree correction.
Invalidation Point: 26,400
NIFTY 50 INDEX Daily Chart – Elliott Wave Analysis & Forecast
The NIFTY 50 INDEX daily chart suggests a major market top around 26,300 in September 2024. Following this peak, the index reversed lower, carving out Minute Wave ((i)) near 23,267. Since then, a potential expanded flat correction has been developing, targeting the 25,000–25,100 range.
An alternative Elliott Wave count is considered below.
- The Intermediate Wave (4) concluded at 15,200 in June 2022.
- Bulls then drove prices higher, subdividing into five waves at the Minor degree, labeled as Waves 1 through 5, reaching the 26,300 mark.
If this structure remains valid, the NIFTY 50 INDEX has shifted lower into a larger-degree correction, targeting a key retracement zone.
NIFTY 50 INDEX – NIFTY (4H Chart) Elliott Wave Technical Analysis
Function: Counter Trend (Minor degree, Grey.)
Mode: Corrective
Structure: Impulse within a larger degree
Position: Minute Wave ((ii))
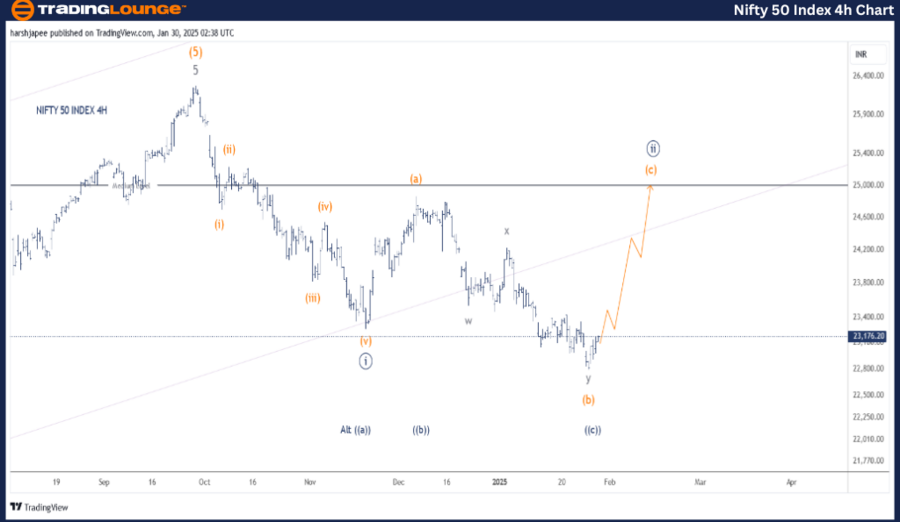
Details: Minute Wave ((ii)) is likely advancing toward 25,000 before resuming the downward trend. The corrective phase is taking shape as an expanded flat (a)-(b)-(c). If correct, a short-term bullish reversal is expected soon. An alternative scenario suggests the entire decline from 26,300 represents a Minute degree correction. Either way, the probability of an upward turn remains high.
Invalidation Point: 26,400
NIFTY 50 INDEX 4H Chart – Elliott Wave Forecast & Market Structure
The NIFTY 50 INDEX 4H chart tracks key Elliott Wave counts since the September 27, 2024 rally, which reached the 26,280–26,300 zone. The initial drop to 23,267 was an impulse wave at the Minuette Degree, labeled as Waves (i) through (v) (Orange), marking the completion of Minute Wave ((i)).
The structure that followed appears to be an expanded flat (a)-(b)-(c), potentially setting up for a rally toward the 25,000–25,100 zone. Additionally, Wave (b) may be forming a complex combination (w-x-y) at Sub-Minuette Degree (Grey).
- If this wave count is valid, bulls are likely to push toward the 25,000–25,100 range, and a break above 23,430 would confirm.
- Alternatively, the entire structure from 26,300 could be unfolding as a larger corrective wave ((a))-((b))-((c)), signaling a bullish phase ahead.
Technical Analyst: Harsh Japee
Source: visit Tradinglounge.com and learn From the Experts Join TradingLounge Here
Previous: S&P BSE Sensex (INDIA) Elliott Wave Technical Analysis
VALUE Offer - Buy 1 Month & Get 3 Months!Click here
Access 7 Analysts Over 200 Markets Covered. Chat Room With Support
Conclusion: Bullish Outlook for NIFTY 50 INDEX Towards 25,000–25,100 Zone
The NIFTY 50 INDEX is advancing within Minuette Wave (c) (Orange), approaching the 25,000–25,100 zone, which is expected to complete Minute Wave ((ii)). A bullish move is anticipated before the larger downtrend resumes.