S&P BSE Sensex (INDIA) Elliott Wave Analysis – Trading Lounge Day Chart
S&P BSE Sensex (INDIA) Wave Technical Analysis
Function: Counter Trend
Mode: Impulsive
Structure: Gray Wave C
Position: Orange Wave 4
Direction Next Higher Degrees: Orange Wave 5
Details: Gray Wave B of 4 appears completed, with Gray Wave C of 4 now in play.
Analysis Overview
This Elliott Wave analysis of the S&P BSE Sensex (India) Index on a daily chart highlights a counter-trend phase with an impulsive mode. The primary wave under observation, Gray Wave C, has commenced following the completion of Gray Wave B within Orange Wave 4. This structure indicates a continuation of the corrective phase within the broader market trend.
Currently, the market is positioned within Orange Wave 4, with Gray Wave C actively progressing. This suggests an extended corrective movement, which must complete before the anticipated development of Orange Wave 5, a phase expected to drive the index back into bullish momentum.
Key Considerations
- The completion of Gray Wave C is a pivotal factor for confirming the transition into Orange Wave 5.
- Traders should monitor this corrective phase closely, as it provides valuable insights into market consolidation and potential breakout points.
- The upcoming Orange Wave 5 is likely to restore bullish momentum, creating new trading opportunities following the resolution of the current corrective structure.
Conclusion
The daily chart analysis for S&P BSE Sensex identifies an ongoing corrective counter-trend phase driven by the formation of Gray Wave C within Orange Wave 4. The completion of Gray Wave B has set the stage for this ongoing corrective move.
The expected emergence of Orange Wave 5 signals a potential return to an upward trend, reinforcing bullish market sentiment once the current corrective phase concludes.
This Elliott Wave analysis provides essential insights for traders, helping them navigate short-term market fluctuations while preparing for long-term growth opportunities. Tracking key wave developments will be crucial in confirming the next market direction.

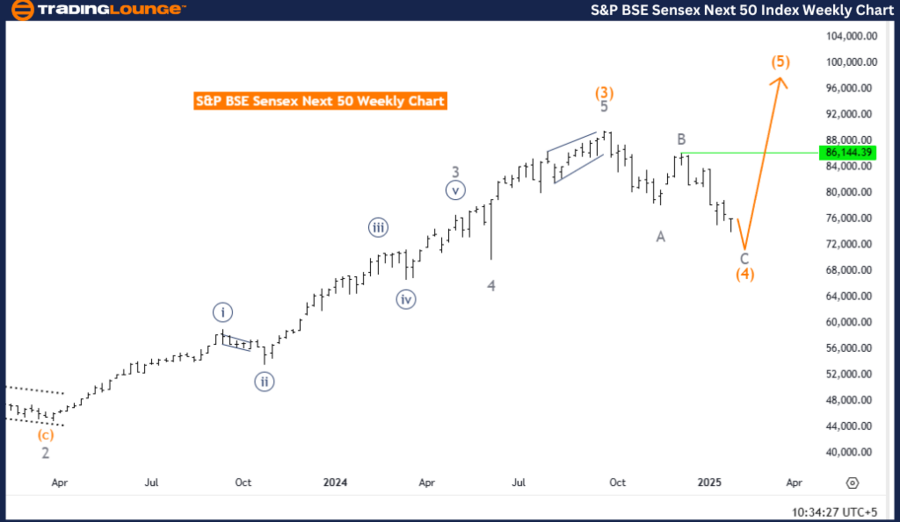
S&P BSE Sensex (INDIA) Elliott Wave Analysis – Trading Lounge Weekly Chart
S&P BSE Sensex (INDIA) Wave Technical Analysis
Function: Counter Trend
Mode: Corrective
Structure: Orange Wave 4
Position: Navy Blue Wave 1
Direction Next Higher Degrees: Orange Wave 5
Details: Orange Wave 3 appears completed, and Orange Wave 4 is nearing its conclusion.
Analysis Overview
This Elliott Wave analysis of the S&P BSE Sensex (India) Index on a weekly chart highlights a corrective counter-trend phase. The primary focus is on Orange Wave 4, which began after the completion of Orange Wave 3. This suggests that the market is experiencing a temporary correction before resuming its upward trajectory.
The index is currently positioned within Navy Blue Wave 1, maintaining a structured corrective movement. Orange Wave 4 appears to be approaching its conclusion, hinting at a potential transition back to a bullish trend as Orange Wave 5 emerges.
Key Considerations
- The completion of Orange Wave 4 is a major milestone, confirming market readiness for the next impulsive phase.
- The expected transition into Orange Wave 5 could reignite bullish momentum, offering new trading opportunities.
- Traders should carefully analyze the Elliott Wave structure to anticipate potential future price movements.
Conclusion
The weekly chart analysis of S&P BSE Sensex highlights an ongoing corrective counter-trend phase within Orange Wave 4. With Orange Wave 3 completed and Orange Wave 4 nearing its end, market participants can anticipate a shift back to bullish momentum as Orange Wave 5 unfolds.
This Elliott Wave perspective provides critical insights for traders, enabling them to strategically align their trading decisions with the expected market shifts. By closely tracking wave formations, traders can prepare for potential trading opportunities within the evolving market trend.
Technical Analyst: Malik Awais
Source: visit Tradinglounge.com and learn From the Experts Join TradingLounge Here
Previous: Hang Seng Index Elliott Wave Technical Analysis
VALUE Offer - Buy 1 Month & Get 3 Months!Click here
Access 7 Analysts Over 200 Markets Covered. Chat Room With Support