22May

QCOM Elliott Wave Signals Impulse Rally Ahead as QUALCOMM Targets Breakout Above $150 Resistance in Bullish Wave Setup

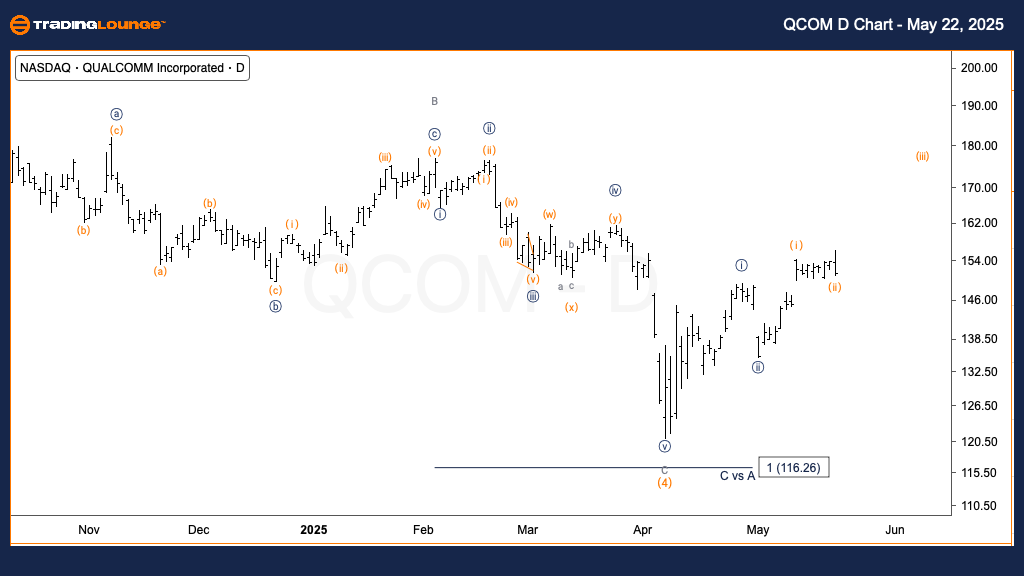
QCOM Elliott Wave Analysis | QUALCOMM Inc. (QCOM) – Daily Chart

QUALCOMM Inc. (QCOM) – Daily Chart Analysis

QCOM Elliott Wave Technical Analysis

Function: Trend

Mode: Impulsive

Structure: Motive

Position: Wave (ii) of {iii}

Direction: Upside in Wave (iii)

Details: QCOM stock is approaching the key medium resistance level at $150, with upward momentum expected in wave (iii).

QUALCOMM Inc. (NASDAQ: QCOM) is consolidating near the critical $150 resistance level, indicating a potential bullish breakout. Elliott Wave analysis suggests the market is finalizing wave (ii) within a broader wave {iii}. If QCOM maintains strength above this level, it could confirm an impulsive wave (iii) rally, reinforcing the bullish trend. This scenario supports continued upward price action in the short term, provided structural confirmation aligns with the analysis.

QCOM-US-stock-day-ch...


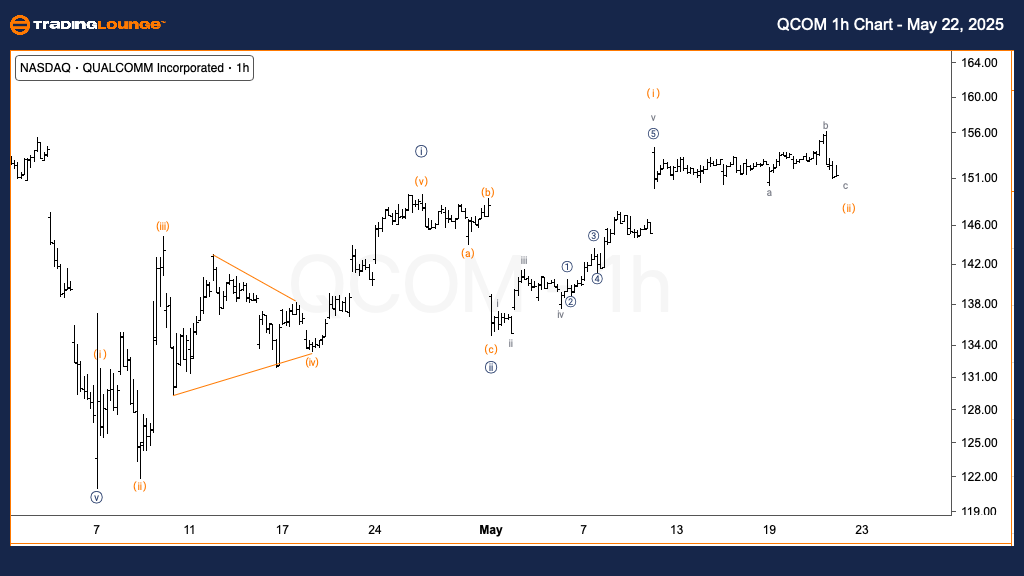
QCOM Elliott Wave Analysis | QUALCOMM Inc. (QCOM) – 1H Chart

QCOM Elliott Wave Technical Analysis

Function: Trend

Mode: Impulsive

Structure: Motive

Position: Wave c of (ii)

Direction: Upside in Wave (iii)

Details: Wave (ii) is developing as a flat correction, with one more leg in wave c expected before a strong rally into wave (iii) of {iii}.

The 1-hour chart of QCOM highlights the final stages of wave (ii), forming as a flat correction. Wave c is anticipated to complete this pattern, after which a significant upside movement into wave (iii) of {iii} could follow. This setup presents a strategic entry opportunity for traders looking to capitalize on the next impulsive wave, particularly if price breaks above the $150 threshold.

Technical Analyst: Alessio Barretta

Source: Visit Tradinglounge.com and learn from the Experts. Join TradingLounge Here 

Previous: Dell Technologies Inc (DELL) Elliott Wave Technical Analysis

VALUE Offer - Buy 1 Month & Get 3 Months!Click here

Access 7 Analysts Over 200 Markets Covered. Chat Room With Support

QCOM-US-stock-1H-cha...

Related

KOSPI Composite Index: Elliott Wave Technical Analysis Provides Insights for Traders, Highlighting Market Activity

KOSPI Composite Index: Elliott Wave Technical Analysis Provides Insights for Traders, Highlighting Market Activity

KOSPI Composite Elliott Wave Analysis for the day and 4-hour chart offers a comprehensive view of th...

Read More >
Commodities: Rising Trends in USD DXY, 10-Year Yields, and Future Upside for Bitcoin, Gold and Silver

Commodities: Rising Trends in USD DXY, 10-Year Yields, and Future Upside for Bitcoin, Gold and Silver

The latest commodity market analysis, employing Elliott Wave Theory, indicates a nearing completion ...

Read More >
Unlocking ASX Trading Success: TRANSURBAN GROUP – TCL Stock Analysis & Elliott Wave Technical Forecast

Unlocking ASX Trading Success: TRANSURBAN GROUP – TCL Stock Analysis & Elliott Wave Technical Forecast

The Transurban Group's stock performance (TCL) on the ASX through the lens of Elliott Wave theor...

Read More >
In-depth insights into S&P/ASX 200 Index Elliott Wave Technical Analysis: Trading and Investing with Our Comprehensive Guide

In-depth insights into S&P/ASX 200 Index Elliott Wave Technical Analysis: Trading and Investing with Our Comprehensive Guide

Discover in-depth insights into S&P/ASX 200 trading and investing with our comprehensive guide. Lear...

Read More >
Technical Analysis of GX Uranium: GX Uranium Commodity Elliott Wave Analysis

Technical Analysis of GX Uranium: GX Uranium Commodity Elliott Wave Analysis

In an ever-evolving uranium market, the GX Uranium ETF (URA) stands out as a pivotal investment oppo...

Read More >
Elliott Wave Analysis of AAVE (AAVEUSD): Downtrend Continuation, Support and Resistance Levels for Crypto Swing Traders

Elliott Wave Analysis of AAVE (AAVEUSD): Downtrend Continuation, Support and Resistance Levels for Crypto Swing Traders

Elliott Wave analysis examines AAVE/USD price trends, identifying a downtrend continuation within a ...

Read More >

$1 for 2 Weeks

then $29 a month!

What a Special Offer!

Trade Recommendations

Unleash the power of deversified trading with our comprehensive portfolio, covering 250+ markets:

  • Stock Trades
  • Crypto Trades
  • Forex Trades
  • Commodity Trades
Elliott Wave Analysis

Gain a competitive edge with expert insights and AI-powered Elliott Wave charting into:

  • Global Indices
  • US Stocks & ASX Stocks
  • Forex & Crypto
  • Commodities
Top-Notch Trading Tools

Equip yourself with the tools of success:

  • Real-time Chat rooms
  • Elliott Wave Algorithm
  • Portfolio tools
  • TradingLevels
  • Screener
  • Trading Game
7 Elliott Wave Analysts

Stay ahead of the market with daily charts and insightful videos
Your secret to strategic trading!

JOIN HERE


Welcome to TradingLounge (ASIC A.R.No. 321187), specialists in trades, trading education and technical analysis, covering stocks, indices, commodities, forex and cryptocurrencies.

When you join TradingLounge you have access to everything we offer, including trade tools, educational content and a social platform to chat with like-minded investors.

Read more

@Copyright 2024 by tradinglounge.com

Contact Us

Australian no: 02 4787 6020

International no: +61 (2) 47876020

Pay with:

Find us on