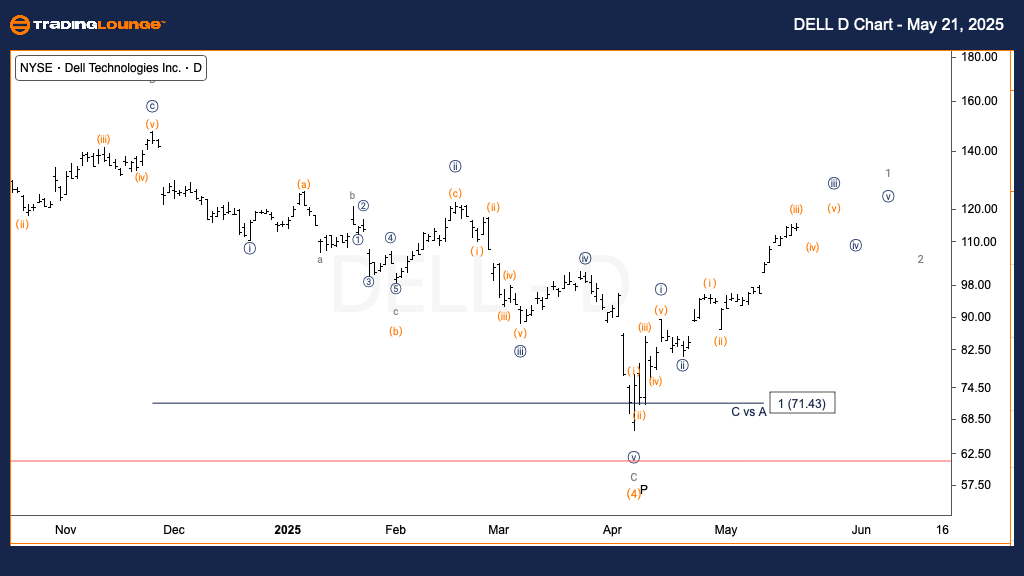
Dell Technologies Inc. (DELL) Elliott Wave Analysis – Trading Lounge Daily Chart
DELL Elliott Wave Technical Analysis
FUNCTION: Trend
MODE: Motive
STRUCTURE: Impulsive
POSITION: Wave {iii} of 1
DIRECTION: Upward in wave {iii}
DETAILS: Current Elliott Wave analysis suggests that DELL stock is actively moving within wave {iii}, with bullish momentum pointing toward a final surge higher into wave (v). The price has consistently held above the key $100 level, signaling strong investor confidence. If this momentum continues, a further advance toward the $130 resistance zone is likely as wave (v) completes.
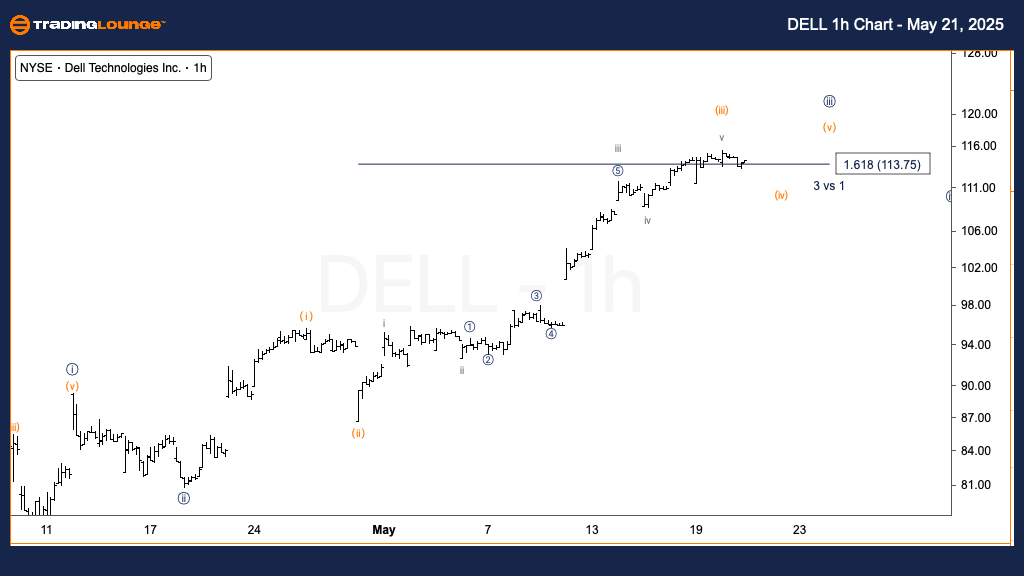
Dell Technologies Inc. (DELL) Elliott Wave Analysis – Trading Lounge 1-Hour Chart
DELL Elliott Wave Technical Analysis
FUNCTION: Trend
MODE: Motive
STRUCTURE: Impulsive
POSITION: Wave (iii) of {iii}
DIRECTION: Near top in wave (iii)
DETAILS: On the intraday chart, DELL stock appears to be nearing the completion of wave (iii), having reached the 1.618 Fibonacci extension of wave (i). A short-term pullback in wave (iv) is anticipated before the stock potentially resumes its upward trajectory in wave (v), continuing the broader Elliott Wave pattern and reinforcing the bullish stock trend.
This dual-timeframe Elliott Wave forecast for DELL stock highlights a strong bullish setup, confirmed by price action above critical support zones. Both the daily and hourly charts signal continued upward movement after a minor corrective phase, offering a clear technical roadmap for traders focused on momentum-based strategies.
Technical Analyst: Alessio Barretta
Source: Visit Tradinglounge.com and learn from the Experts. Join TradingLounge Here
Previous: Texas Instruments Inc. (TXN) Elliott Wave Technical Analysis
VALUE Offer - Buy 1 Month & Get 3 Months!Click here
Access 7 Analysts Over 200 Markets Covered. Chat Room With Support