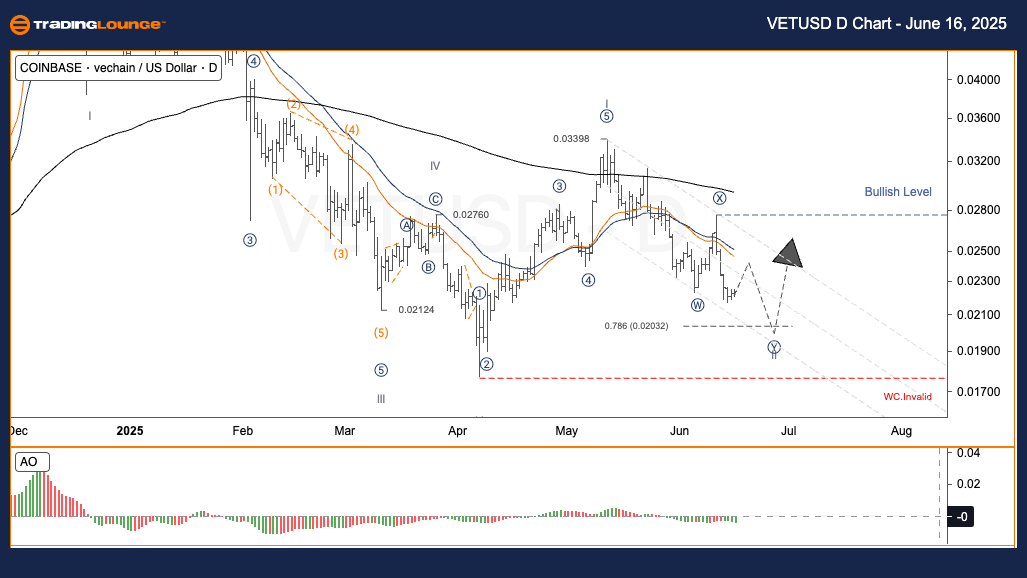
VeChain / U.S. Dollar (VETUSD) Elliott Wave Analysis – TradingLounge Daily Chart
VETUSD Elliott Wave Technical Forecast
Function: Counter-Trend
Mode: Corrective
Structure: Double Zigzag Correction
Position: Wave Y
Next Expected Move (Larger Wave Structure): Still developing
Invalidation Level: Not yet determined
Trading Strategy Overview – Daily Time Frame
VeChain (VETUSD) initiated a bullish move from around $0.0212 in early April, forming what appears to be a wave I. Current Elliott Wave analysis suggests that VETUSD is now in a wave II corrective phase, unfolding as a Double Zigzag correction pattern.
Strategy Notes:
- ✅ Swing Traders (Short-Term Insight):
Monitor potential wave Y completion within the $0.020–$0.021 range. A buy trade can be initiated to benefit from a possible wave III rally.
If VETUSD dips below $0.017, this wave scenario becomes invalid and a new Elliott Wave count would be necessary.
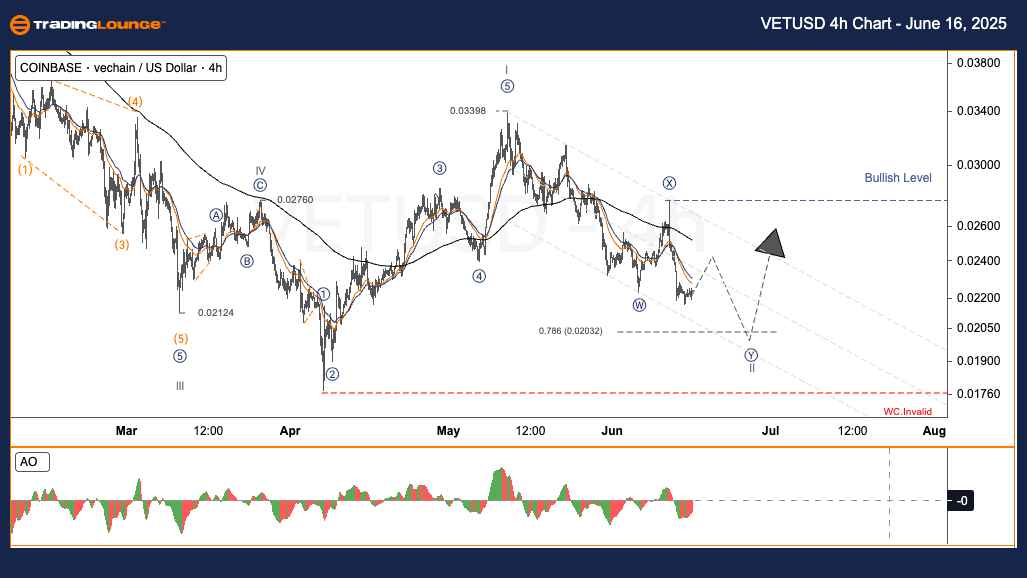
VeChain / U.S. Dollar (VETUSD) Elliott Wave Analysis – TradingLounge 4-Hour Chart
VETUSD Elliott Wave Technical Forecast
Function: Counter-Trend
Mode: Corrective
Structure: Double Zigzag
Position: Wave Y
Next Expected Move (Larger Wave Structure): Yet to unfold
Invalidation Level: Not confirmed
Trading Strategy Overview – 4H Time Frame
The 4-hour chart reflects similar dynamics seen in the Daily chart. VeChain seems to have completed a wave I, followed by a wave II correction forming through a Double Zigzag. Strategy remains consistent:
Strategy Notes:
Look for entries around the $0.020–$0.021 support zone to catch the potential breakout of wave III.
Any drop under $0.017 invalidates this wave count, requiring a revised technical outlook.
Technical Analyst: Malik Awais
Source: Visit Tradinglounge.com and learn from the Experts. Join TradingLounge Here
Previous: ETHUSD Elliott Wave Technical Analysis
VALUE Offer - $1 for 2 Weeks then $29 a month!Click here
Access 7 Analysts Over 200 Markets Covered. Chat Room With Support