26Feb

Solana (SOL/USD) Elliott Wave Analysis, Price Prediction, Key Support Levels, Trading Strategy & Fibonacci Retracement Insights for Crypto Investors

Solana / U.S. Dollar (SOLUSD) Elliott Wave Analysis – TradingLounge Daily Chart

SOLUSD Elliott Wave Technical Analysis

Function: Counter Trend

Mode: Corrective

Structure: Zigzag

Position: Wave A

Next Higher Degree Direction: Wave B or 2

Wave Cancelation Level:

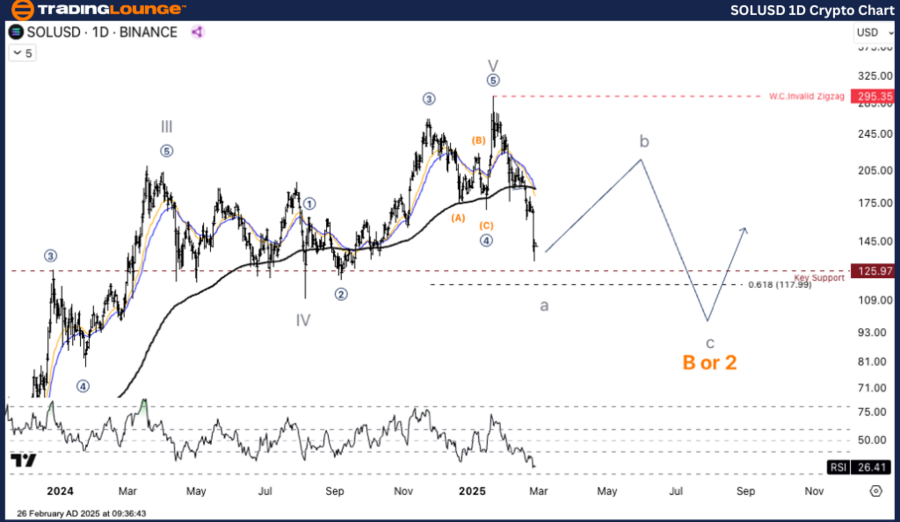
Analysis Details: Solana (SOL/USD) has retraced from its recent high of $295.31 and is currently heading towards a significant support zone at $125.97.

Solana / U.S. Dollar (SOLUSD) Trading Strategy

Solana (SOL/USD) was a top-performing cryptocurrency, reaching a peak of $295.31 before undergoing a sharp correction. Elliott Wave traders are now analyzing whether this is a short-term consolidation or the start of a deeper downtrend.

At present, SOL/USD is testing the $125.97 support level. A continued decline could lead to a further drop towards $117.99, which aligns with the Fibonacci 61.8% retracement level. If SOL/USD fails to hold this level, the price may extend its downward move within Wave B or 2.

Trading Strategies

Long Strategy

Buy on pullback to key support levels

If SOL/USD enters the $125 – $117 range and exhibits strong buying pressure, it could present a short-term buying opportunity.

  • Profit Target: $160 – $180 (Wave B)

Risk Management

  • If SOL/USD breaks below $117, the downward trend may accelerate, requiring traders to look for deeper support between $80 – $90.

SOLUSD-1d-crypto-cha...


Solana / U.S. Dollar (SOLUSD) Elliott Wave Analysis – TradingLounge H4 Chart

SOLUSD Elliott Wave Technical Analysis

Function: Counter Trend

Mode: Corrective

Structure: Zigzag

Position: Wave A

Next Higher Degree Direction: Wave B or 2

Wave Cancelation Level:

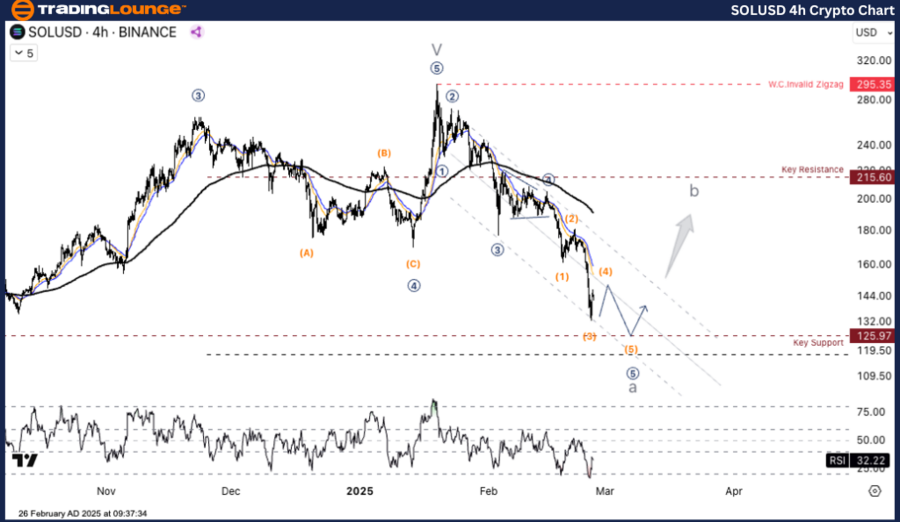
Analysis Details: SOL/USD has pulled back from its peak of $295.31 and is moving towards a critical support zone at $125.97.

Solana / U.S. Dollar (SOLUSD) Trading Strategy

Solana (SOL/USD) was one of the most actively traded digital assets, reaching $295.31 before experiencing a correction. Traders are now determining whether this retracement is a temporary consolidation or the beginning of a prolonged bearish trend.

Currently, SOL/USD is approaching $125.97, a major support level. If the price continues its descent, it may test $117.99 (Fibonacci 61.8%). A failure to hold above this level could indicate further downside movement within Wave B or 2.

Trading Strategies

Long Strategy

Buy on pullback to key support levels

If SOL/USD dips into the $125 – $117 range and displays strong buying momentum, it may offer a short-term trading opportunity.

  • Profit Target: $160 – $180 (Wave B)

Risk Management

  • If SOL/USD breaks below $117, the downward trend may extend, prompting traders to seek support between $80 – $90.

SOLUSD-4h-crypto-cha...

Technical Analyst: Kittiampon Somboonsod, CEWA

Source: visit Tradinglounge.com and learn From the Experts Join TradingLounge Here 

Previous: BTCUSD Elliott Wave Technical Analysis

VALUE Offer - Buy 1 Month & Get 3 Months!Click here

Access 7 Analysts Over 200 Markets Covered. Chat Room With Support

Related

Discover effective trading strategies for U.S.Dollar /Canadian Dollar (USD/CAD) Forex Elliott Wave Technical Analysis

Discover effective trading strategies for U.S.Dollar /Canadian Dollar (USD/CAD) Forex Elliott Wave Technical Analysis

Our comprehensive USD/CAD Elliott Wave analysis provides detailed insights into the US Dollar to Can...

Read More >
Specific Price levels and Market Trends for ASX REA GROUP LTD – REA Stock Analysis & Elliott Wave Technical Forecast

Specific Price levels and Market Trends for ASX REA GROUP LTD – REA Stock Analysis & Elliott Wave Technical Forecast

This article provides a comprehensive Elliott Wave analysis of ASX: REA GROUP LTD. It includes detai...

Read More >
Comprehensive Analysis of the Swiss Market Index (SMI) delves into the Elliott Wave Technical Analysis: day and weekly charts

Comprehensive Analysis of the Swiss Market Index (SMI) delves into the Elliott Wave Technical Analysis: day and weekly charts

This comprehensive analysis of the Swiss Market Index (SMI) delves into the Elliott Wave patterns on...

Read More >
Explores the Stock’s Current Market Structure: Apple Inc. (AAPL) Stocks Elliott Wave Technical Analysis

Explores the Stock’s Current Market Structure: Apple Inc. (AAPL) Stocks Elliott Wave Technical Analysis

This comprehensive Elliott Wave analysis of Apple Inc. (AAPL) explores the stock’s current market s...

Read More >
VeChain/U.S. dollar(VETUSD) Elliott Wave Technical Analysis 24 October 23

VeChain/U.S. dollar(VETUSD) Elliott Wave Technical Analysis 24 October 23

VeChain/U.S. dollar(VETUSD) Elliott Wave Technical Analysis TradingLounge Daily Chart and 4-Hour Cha...

Read More >
Provides a Diversified Portfolio in the Uranium industry With GX URA ETF Commodity Elliott Wave Technical Analysis

Provides a Diversified Portfolio in the Uranium industry With GX URA ETF Commodity Elliott Wave Technical Analysis

The GX URA ETF, or Global X Uranium ETF, provides a diversified portfolio in the uranium industry. T...

Read More >

Buy 1 Month

Get 3 Months!

Special Offer:

Trade Recommendations

Unleash the power of deversified trading with our comprehensive portfolio, covering:

  • Stock Trades
  • Crypto Trades
  • Forex Trades
  • Commodity Trades
Elliott Wave Analysis

Gain a competive edge with expert insights in to:

  • Global Indices
  • US Stocks & ASX Stocks
  • Forex & Crypto
  • Commodities
Top-Notch Trading Tools

Equip yourself with the tools of success:

  • Social Chat
  • Elliott Wave Algorithm
  • Screener
  • TradingLevels
  • Trading Game
7 Elliott Wave Analysts

Stay ahead of the market with daily charts and insightful videos
-Your secret to strategic trading!

JOIN HERE


Welcome to TradingLounge (ASIC A.R.No. 321187), specialists in trades, trading education and technical analysis, covering stocks, indices, commodities, forex and cryptocurrencies.

When you join TradingLounge you have access to everything we offer, including trade tools, educational content and a social platform to chat with like-minded investors.

Read more

@Copyright 2024 by tradinglounge.com

Contact Us

Australian no: 02 4787 6020

International no: +61 (2) 47876020

Pay with:

Find us on