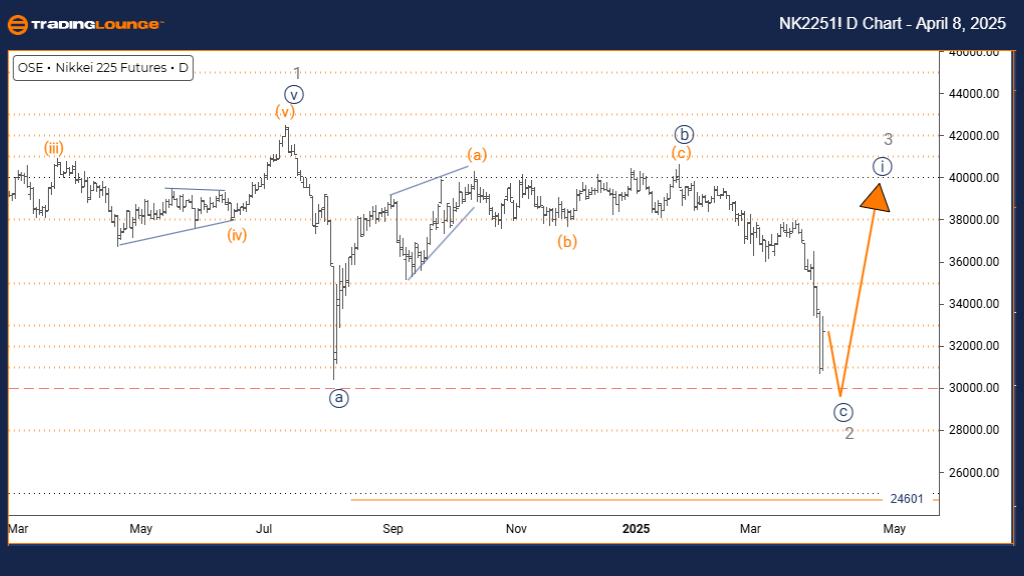
NIKKEI 225 (N225) Elliott Wave Forecast – TradingLounge Daily Chart
Japan Stock Market Analysis
NIKKEI 225 Elliott Wave Technical Analysis
Function: Counter-Trend
Mode: Impulsive (Wave C)
Structure: Navy Blue Wave C
Position: Gray Wave 2
Next Higher Degree Direction: Navy Blue Wave 1
Invalidation Level: 24,601
Analysis Overview:
The daily Elliott Wave forecast for the NIKKEI 225 reveals a counter-trend move within a broader corrective pattern in Japan’s benchmark stock index. The current wave focus is Navy Blue Wave C, part of the ongoing Gray Wave 2 structure.
Price action confirms the completion of Navy Blue Wave B, with the index now progressing through an impulsive Navy Blue Wave C. This suggests the NIKKEI 225 may be nearing the final stages of its correction and preparing to resume the dominant bullish trend.
The invalidation level is set at 24,601—any movement below this point would negate the current Elliott Wave count and call for a reassessment.
Wave Structure Insights & Strategic Notes:
The daily chart provides a precise view of the index within the higher-degree Elliott Wave cycle. The ongoing Navy Blue Wave C, forming part of Gray Wave 2, shows impulsive characteristics—typical of Wave C within corrective formations.
Recognizing these wave degrees is crucial. Traders should focus on identifying five-wave structures, which often signal the completion of corrections and potential bullish trend resumption.
Trading Considerations:
- Short-Term Opportunity: Monitor the development of Wave C for signs of correction completion.
- Long-Term View: Prepare for potential upward continuation following the end of Gray Wave 2.
- Risk Management: The Key invalidation level to watch remains at 24,601.
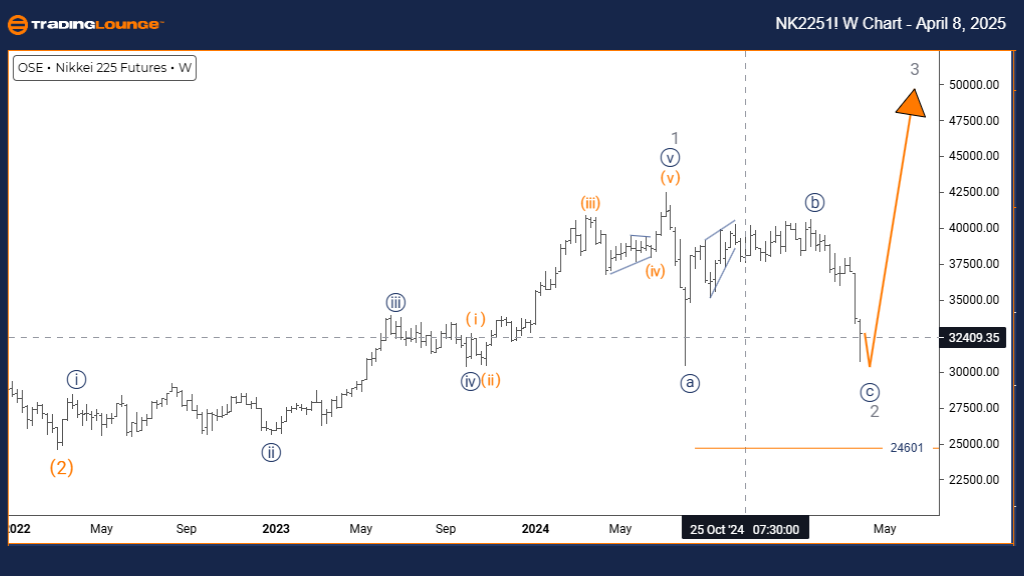
NIKKEI 225 (N225) – Elliott Wave Forecast – TradingLounge Weekly Chart
Japan’s Primary Stock Index Outlook
NIKKEI 225 – Elliott Wave Technical Analysis
Function: Counter-Trend
Mode: Impulsive (Wave C)
Structure: Navy Blue Wave C
Position: Gray Wave 2
Next Higher Degree Direction: Gray Wave 3
Invalidation Level: 24,601
Analysis Overview:
The weekly Elliott Wave analysis of the NIKKEI 225 presents a detailed counter-trend scenario within Japan’s major stock index, highlighting a corrective wave structure with medium-term implications. Navy Blue Wave C remains in focus as part of the larger Gray Wave 2 phase.
Following the conclusion of Navy Blue Wave B, the index is progressing through an impulsive Navy Blue Wave C. This phase signifies a continuation of the corrective structure and a key turning point in the overall market cycle.
A break below the 24,601 invalidation level would invalidate the current wave interpretation and prompt a fresh wave count.
Market Structure and Strategic Outlook:
The weekly chart outlines the NIKKEI 225’s position in the higher-degree Elliott Wave structure. Navy Blue Wave C is expected to behave impulsively—consistent with standard Wave C patterns in corrective sequences.
Understanding wave behavior and relationships remains essential. Traders should monitor for the formation of five-wave sequences within Wave C, often indicative of the correction’s end and signaling the beginning of Wave 3.
Trading Considerations:
- Medium-Term View: Anticipate potential bullish Wave 3 following completion of Wave C.
- Short-Term Action: Identify tactical entry and exit points as Wave C unfolds.
- Risk Management: 24,601 remains the critical level for invalidating the current wave structure.
Technical Analyst: Malik Awais
Source: visit Tradinglounge.com and learn From the Experts Join TradingLounge Here
Previous: S&P 500 Elliott Wave Technical Analysis
VALUE Offer - Buy 1 Month & Get 3 Months!Click here
Access 7 Analysts Over 200 Markets Covered. Chat Room With Support