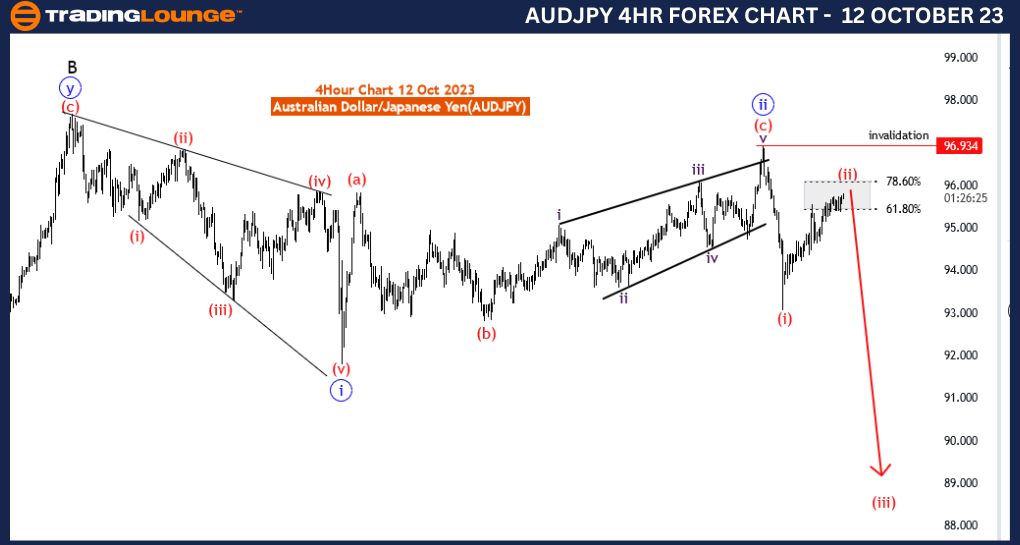
AUDJPY Elliott Wave Analysis Trading Lounge 4 Hour Chart,12 October 23
Australian Dollar / Japanese Yen(AUDJPY) 4 Hour Chart
AUDJPY Elliott Wave Technical Analysis
AUDJPY Elliott Wave Technical Analysis
Function: Counter Trend
Mode: corrective as red wave 2
Structure: red wave 2 of 3
Position: Black wave C
Direction Next lower Degrees: wave (3 of C)
Details: red wave 2 of 3 still in play and near to end between fib level 61.80 to 78.60. After that, red wave 3 of blue wave 3 will start. Wave Cancel invalid level:96.934
The AUD/JPY Elliott Wave Analysis for 12 October 23, focuses on the Australian Dollar/Japanese Yen (AUD/JPY) currency pair, providing insights using the Elliott Wave theory on a 4-hour chart.
This analysis primarily serves as a "Counter Trend" function. Counter-trend analysis is essential for traders who aim to identify and exploit potential market reversals or corrections against the prevailing trend. Understanding counter-trend movements can help traders make informed decisions during corrective phases.
The mode of analysis is "corrective," which indicates a detailed examination of corrective wave patterns within the Elliott Wave framework. Corrective waves are critical for traders as they often precede trend reversals, making them significant points of interest.
The structure being analyzed is red wave 2 of 3." This signifies an in-depth evaluation of the second wave within a larger Elliott Wave sequence. The analysis of wave 2 is crucial for traders as it provides insights into potential price movements and trend reversals.
In terms of market direction, the analysis indicates that red wave 2 of 3" is still in play and is expected to end within the range of fib levels 61.80 to 78.60. Understanding the potential termination point of a corrective wave is essential for traders looking to time their entries and exits effectively.
The "Wave Cancel invalid level" for this analysis is identified at 96.934. This level serves as a reference point for traders to assess the validity of their trading strategies and manage risk effectively.

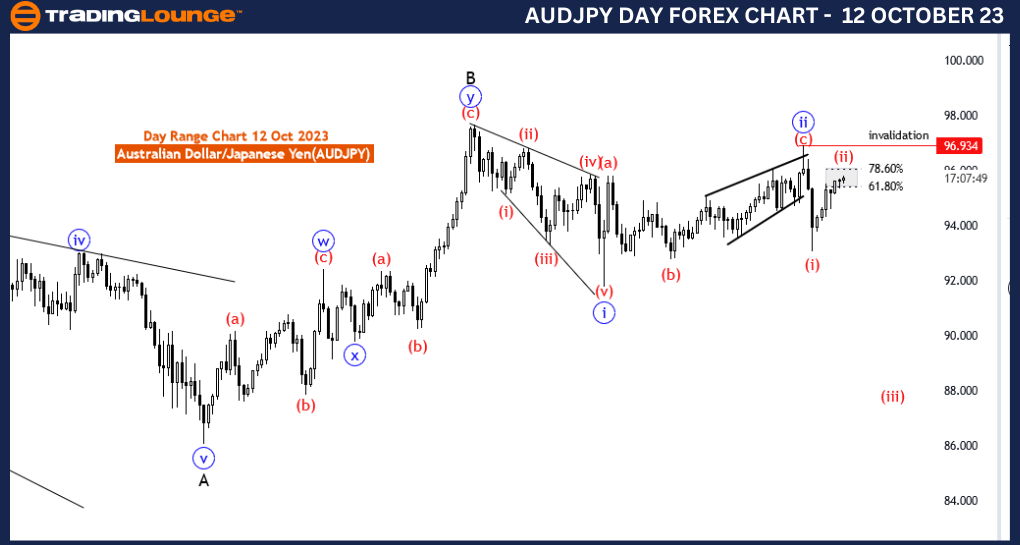
AUDJPY Elliott Wave Analysis Trading Lounge Day Chart,12 October 23
Australian Dollar / Japanese Yen(AUDJPY) Day Chart
AUDJPY Elliott Wave Technical Analysis
AUDJPY Elliott Wave Technical Analysis
Function: Counter Trend
Mode: corrective as red wave 2
Structure: red wave 2 of 3
Position: Black wave C
Direction Next lower Degrees: wave (3 of C)
Details: red wave 2 of 3 still in play and near to end between fib level 61.80 to 78.60 . After that, red wave 3 of blue wave 3 will start. Wave Cancel invalid level:96.934
The AUD/JPY Elliott Wave Analysis for 12 October 23, delves into the dynamics of the Australian Dollar/Japanese Yen (AUD/JPY) currency pair, employing the Elliott Wave theory, particularly on a daily chart.
The primary function of this analysis is to counter the prevailing trend. Counter-trend analysis plays a crucial role in aiding traders to pinpoint potential market reversals or corrections against the dominant trend. This information is invaluable for traders looking to capitalize on market movements contrary to the existing trend.
The mode of analysis is classified as "corrective," which indicates an in-depth examination of corrective wave patterns within the Elliott Wave framework. Corrective waves are instrumental in providing traders with insights into potential price adjustments and trend reversals. Hence, understanding and accurately interpreting corrective wave patterns are critical for traders.
The analysis focuses on the "red wave 2 of 3." This implies a meticulous evaluation of the second wave within a broader Elliott Wave sequence. Such an examination is pivotal for traders as it offers insights into prospective price movements and the likelihood of trend reversals.
Regarding market direction, the analysis indicates that "red wave 2 of 3" is still in play and is expected to conclude within the range of Fibonacci levels, specifically between 61.80 and 78.60. Knowing the likely termination point of a corrective wave is essential for traders who aim to optimize their trading decisions, including entries and exits.
The "Wave Cancel invalid level" for this analysis is determined at 96.934. This level serves as a critical reference point for traders to gauge the effectiveness of their trading strategies and to manage risk efficiently.
In summary, the AUD/JPY Elliott Wave Analysis for 12 October 23, provides valuable insights into the ongoing corrective phase within the Elliott Wave framework. Traders are advised to closely monitor the progression of "red wave 2 of 3," especially within the specified Fibonacci level range, as it may present trading opportunities. This analysis serves as a pivotal resource for traders navigating the intricacies of the AUD/JPY currency pair, particularly in the context of the corrective wave patterns currently unfolding.
