Welcome to Our Latest Elliott Wave Analysis for Caterpillar Inc. (CAT)

In this comprehensive Elliott Wave analysis of Caterpillar Inc. (CAT), we delve into CAT's price movements using the Elliott Wave Theory. This analysis aims to provide traders with valuable insights into potential trading opportunities based on the current market structure. We will examine both the daily and 1-hour charts to offer a well-rounded perspective on CAT's price action.

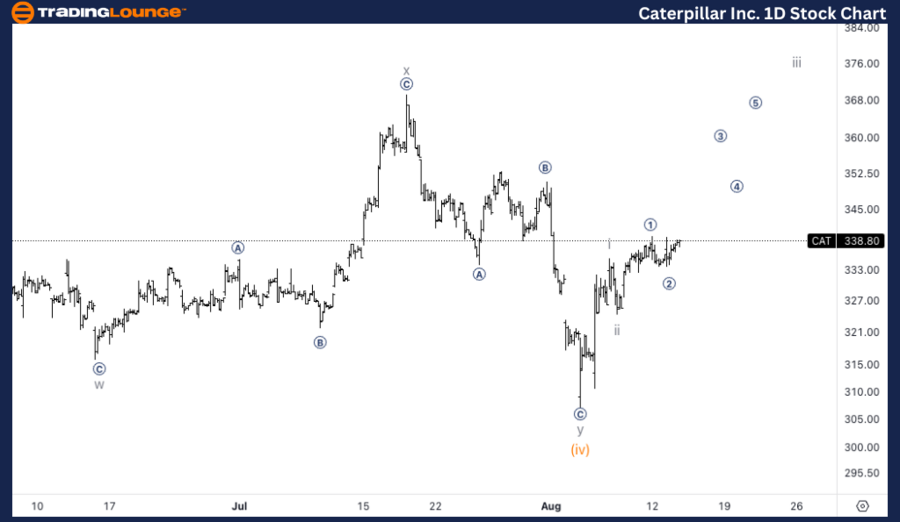
CAT Elliott Wave Analysis – Trading Lounge Daily Chart

Caterpillar Inc. (CAT) Daily Chart Analysis

CAT Elliott Wave Technical Analysis

Function: Trend

Mode: Impulsive

Structure: Motive

Position: Minuette wave (v)

Direction: Upside into wave (v)

Details: We are currently anticipating an upward movement into wave (v) as the correction in wave (iv) appears to have concluded. The price rebound from $300 suggests a potential rise towards the Medium Level at $400 with wave (v).

Caterpillar Inc. CAT Technical Analysis – Daily Chart

After completing a corrective wave (iv), CAT has sharply rebounded from the $300 level. This significant bounce indicates that wave (v) is likely underway, with the potential to advance towards the Medium Level at $400. The completion of wave (v) could mark the end of the current impulsive cycle, presenting a crucial phase for traders to monitor for potential profit-taking or the onset of a new corrective phase.

Caterpillar-Inc-1D-S...


CAT Elliott Wave Analysis – Trading Lounge 1H Chart

Caterpillar Inc. (CAT) 1H Chart Analysis

CAT Elliott Wave Technical Analysis

Function: Trend

Mode: Impulsive

Structure: Motive

Position: Wave iii of (v)

Direction: Upside in wave iii

DETAILS: Looking for a potential 1-2 within sub-minuette wave iii, or else we could be in a leading diagonal in wave i, with what is labelled as wave 1 and 2, as wave 3 and 4 of the diagonal.

CAT Elliott Wave Technical Analysis – 1H Chart

The 1-hour chart suggests that CAT is likely progressing within subminuette wave iii of (v). There are two possible scenarios unfolding: (1) a traditional 1-2 structure within wave iii, or (2) the formation of a leading diagonal, where what is currently labeled as waves 1 and 2 could actually be waves 3 and 4 of the diagonal. In either case, the structure implies further upside as wave iii completes and moves towards wave v.

Technical Analyst: Alessio Barretta

Source: visit Tradinglounge.com and learn From the Experts Join TradingLounge Here 

See Previous: The Coca-Cola Company (KO) Elliott Wave Technical Analysis 

Special Trial Offer - 0.76 Cents a Day for 3 Months! Click here

Access 7 Analysts Over 170 Markets Covered. Chat Room With Support

Caterpillar-Inc-1h-S...

Related

Intricacies of market movements: New Zealand Dollar/U.S.Dollar (NZDUSD) Elliott Wave Technical Analysis

Intricacies of market movements: New Zealand Dollar/U.S.Dollar (NZDUSD) Elliott Wave Technical Analysis

Unlock insights into the NZDUSD currency pair with our expert Elliott Wave analysis. Our detailed br...

Read More >
Technical Analysis of GX Uranium: GX Uranium Commodity Elliott Wave Analysis

Technical Analysis of GX Uranium: GX Uranium Commodity Elliott Wave Analysis

In an ever-evolving uranium market, the GX Uranium ETF (URA) stands out as a pivotal investment oppo...

Read More >
Texas Instruments (TXN) Stock Ready for a Breakout? TXN Elliott Wave Technical Analysis Reveals Key Levels and Price Trends!

Texas Instruments (TXN) Stock Ready for a Breakout? TXN Elliott Wave Technical Analysis Reveals Key Levels and Price Trends!

This Texas Instruments (TXN) Elliott Wave analysis examines TXN stock price trends, identifying key ...

Read More >
ASX:IAG Elliott Wave Analysis, Stock Forecast, Price Trends, Wave Patterns, Market Insights, and Trading Strategies for Investors

ASX:IAG Elliott Wave Analysis, Stock Forecast, Price Trends, Wave Patterns, Market Insights, and Trading Strategies for Investors

Get the latest ASX:IAG Elliott Wave analysis and stock forecast. Learn how wave patterns influence I...

Read More >
British Pound/Japanese Yen(GBPJPY) Elliott Wave Technical Analysis 23 October 23

British Pound/Japanese Yen(GBPJPY) Elliott Wave Technical Analysis 23 October 23

The British Pound/Japanese Yen(GBPJPY) Elliott Wave Analysis for the day and 4-hour chart on 23 Octo...

Read More >
Wheat Commodity Elliott Wave Technical Analysis: Bullish Corrections and Future Price Movements in Wheat Futures

Wheat Commodity Elliott Wave Technical Analysis: Bullish Corrections and Future Price Movements in Wheat Futures

Our latest wheat price forecast for 2024 is based on Elliott Wave analysis, highlighting key market ...

Read More >

Buy 1 Month

Get 3 Months!

Special Offer:

Trade Recommendations

Unleash the power of deversified trading with our comprehensive portfolio, covering:

  • Stock Trades
  • Crypto Trades
  • Forex Trades
  • Commodity Trades
Elliott Wave Analysis

Gain a competive edge with expert insights in to:

  • Global Indices
  • US Stocks & ASX Stocks
  • Forex & Crypto
  • Commodities
Top-Notch Trading Tools

Equip yourself with the tools of success:

  • Social Chat
  • Elliott Wave Algorithm
  • Screener
  • TradingLevels
  • Trading Game
7 Elliott Wave Analysts

Stay ahead of the market with daily charts and insightful videos
-Your secret to strategic trading!

JOIN HERE


Welcome to TradingLounge (ASIC A.R.No. 321187), specialists in trades, trading education and technical analysis, covering stocks, indices, commodities, forex and cryptocurrencies.

When you join TradingLounge you have access to everything we offer, including trade tools, educational content and a social platform to chat with like-minded investors.

Read more

@Copyright 2024 by tradinglounge.com

Contact Us

Australian no: 02 4787 6020

International no: +61 (2) 47876020

Pay with:

Find us on