EURGBP Elliott Wave Analysis Trading Lounge Day Chart,
Euro/British Pound(EURGBP) Day Chart Analysis
EURGBP Elliott Wave Technical Analysis
FUNCTION: Counter Trend
MODE: corrective
STRUCTURE: red wave C
POSITION: blue wave Y of B
DIRECTION NEXT HIGHER DEGREES: black wave C
DETAILS: red wave B of blue wave Y looking completed, now red wave C is in play.
Wave Cancel invalid level: 0.86449
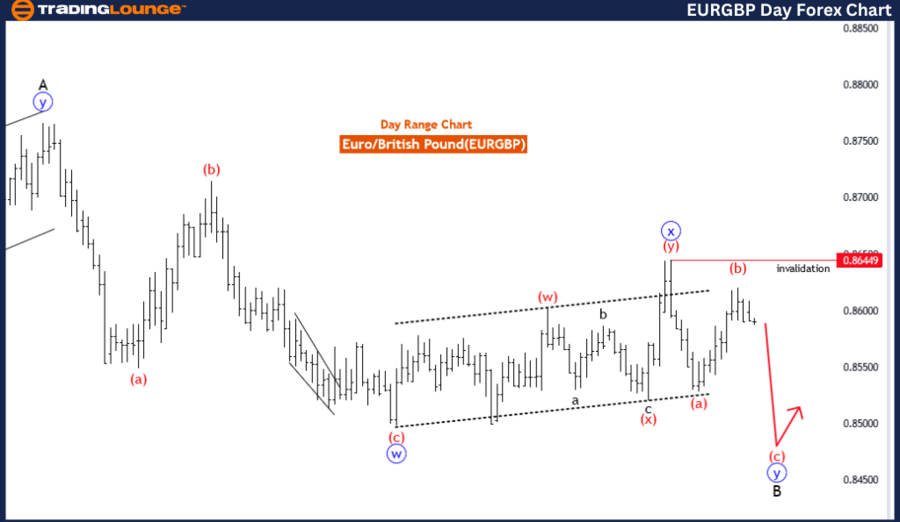
The day chart analysis of EURGBP offers valuable insights into the Elliott Wave pattern governing the price movements of the Euro against the British Pound, focusing on potential trends and reversals.
Function:
The identified function in the analysis is "Counter Trend," indicating that the EURGBP pair is currently exhibiting a temporary deviation from the prevailing trend. This suggests that the market is experiencing a corrective phase within a broader trend, offering opportunities for contrarian trading strategies.
Mode:
The mode specified is "corrective," suggesting that the current price action is part of a corrective wave cycle within the Elliott Wave sequence. This implies that the movement observed in the market is corrective in nature, serving as a temporary interruption to the overall trend direction.
Structure:
The structure highlighted is "red wave C," representing the specific wave count within the corrective phase. This indicates that the EURGBP pair is currently undergoing a corrective wave labeled as "red wave C," which is part of a broader corrective pattern.
Position:
The position identified is "blue wave Y of B," specifying the location of the current wave within the broader Elliott Wave pattern. This implies that the market is advancing within the "blue wave Y" phase of the corrective wave cycle labeled as "B."
Direction for Next Higher Degrees:
The direction indicated for the next higher degrees is "black wave C," suggesting the potential continuation of the corrective wave cycle at a broader degree. This implies that the current corrective movement may extend further before the broader trend resumes.
Details:
The analysis notes that "red wave B" of "blue wave Y" appears to have completed, signaling the onset of "red wave C." This suggests that the EURGBP pair may experience further corrective movement in the near term. The wave cancellation or invalidation level is set at 0.86449, providing a critical threshold for assessing the validity of the current wave count.
In summary, the day chart analysis of EURGBP suggests that the pair is undergoing a corrective phase within the broader trend. The corrective structure and identified wave counts offer insights for traders looking to navigate the market and capitalize on potential price movements.
EURGBP Elliott Wave Analysis Trading Lounge 4-Hour Chart,
Euro/British Pound(EURGBP) 4 Hour Chart Analysis
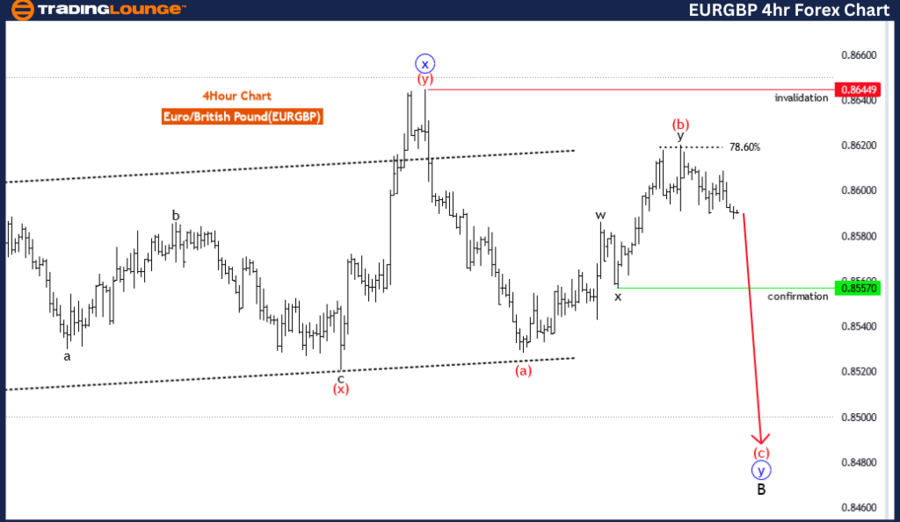
EURGBP Elliott Wave Technical Analysis
FUNCTION: Counter Trend
MODE: impulsive as C
STRUCTURE: red wave C
POSITION: blue wave Y of B
DIRECTION NEXT HIGHER DEGREES: black wave C
DETAILS: red wave B of blue wave Y looking completed, now red wave C is in play.
Wave Cancel invalid level: 0.86449
The 4-hour chart analysis of EURGBP provides insights into the Elliott Wave pattern governing the price movements of the Euro against the British Pound, shedding light on potential trends and reversals.
Function:
The identified function in the analysis is "Counter Trend," suggesting that the EURGBP pair is currently exhibiting a temporary deviation from the prevailing trend. This implies that the market is experiencing a corrective phase within a broader trend.
Mode:
The mode specified is "impulsive as C," indicating that the current price action is characterized by decisive and forceful momentum. This suggests that the corrective movement observed in the market is unfolding in a rapid and assertive manner.
Structure:
The structure highlighted is "red wave C," representing the specific wave count within the Elliott Wave sequence. This indicates that the EURGBP pair is currently undergoing a corrective wave cycle labeled as "red wave C."
Position:
The position identified is "blue wave Y of B," specifying the location of the current wave within the broader Elliott Wave pattern. This implies that the market is advancing within the "blue wave Y" phase of the corrective wave cycle labeled as "B."
Direction for Next Higher Degrees:
The direction indicated for the next higher degrees is "black wave C," suggesting the potential continuation of the corrective wave cycle at a broader degree. This implies that the current corrective movement may extend further before the broader trend resumes.
Details:
The analysis notes that "red wave B" of "blue wave Y" appears to have completed, signalling the onset of "red wave C." This suggests that the EURGBP pair may experience further corrective movement in the near term. The wave cancellation or invalidation level is set at 0.86449, providing a critical threshold for assessing the validity of the current wave count.
In summary, the 4-hour chart analysis of EURGBP suggests that the pair is undergoing a corrective phase within the broader trend. The impulsive nature of the corrective movement and the identified wave structure provide valuable insights for traders seeking to anticipate potential price developments in the market.
Technical Analyst: Malik Awais
Source: visit Tradinglounge.com and learn From the Experts Join TradingLounge Here
See Previous: British Pound/U.S.Dollar(GBPUSD) Forex Elliott Wave Technical Analysis
Special Trial Offer - 0.76 Cents a Day for 3 Months! Click here
Access 7 Analysts Over 170 Markets Covered. Chat Room With Support