NASDAQ Elliott Wave Analysis Trading Lounge Day Chart
NASDAQ Index Daily Chart Analysis
NASDAQ Elliott Wave Technical Analysis
-
Function: Trend
-
Mode: Impulsive
-
Structure: Gray wave 1
-
Position: Orange wave 5
-
Direction Next Lower Degrees: Gray wave 2
-
Details: Orange wave 4 appears completed, and now gray wave 1 of orange wave 5 is in progress.
- Wave Cancel Invalidation Level: 17245.9
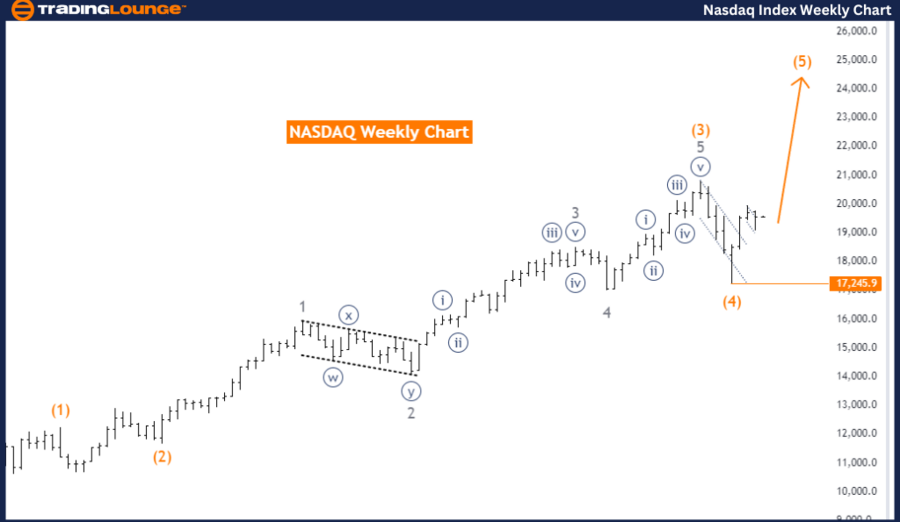
The NASDAQ daily chart, according to Elliott Wave analysis, indicates the market is currently in a trending phase. The analysis identifies the market as being in an impulsive mode, suggesting a continuation of the broader upward trend. The primary focus is on gray wave 1, marking the initiation of a new wave cycle.
The market is currently positioned in orange wave 5, which represents the final wave in the current sequence. This follows the completion of orange wave 4, indicating that the corrective phase has ended, and the market is now progressing upward in the final phase of this cycle.
Looking at the direction for the next lower degrees, attention shifts to gray wave 2. This suggests that after gray wave 1 completes, the market may enter a corrective phase within gray wave 2 before potentially resuming its upward movement.
Currently, gray wave 1 of orange wave 5 is active, marking the early stages of the final wave within this sequence. The expectation is for the upward trend to continue unless the price reaches the wave cancel invalidation level of 17245.9, which would invalidate the current wave count.
In summary, the NASDAQ daily chart shows the market remains in a trending phase, with the current position in orange wave 5. Following the completion of orange wave 4, the market is advancing within gray wave 1 of orange wave 5. The analysis predicts continued upward movement, with a focus on gray wave 2 next. This analysis holds as long as the price remains above the wave cancel invalidation level of 17245.9.
NASDAQ Elliott Wave Analysis Trading Lounge Weekly Chart
NASDAQ Elliott Wave Technical Analysis
-
Function: Trend
-
Mode: Impulsive
-
Structure: Orange wave 5
-
Direction Next Higher Degrees: Orange wave 5 (started)
-
Details: Orange wave 4 appears completed, and now orange wave 5 is in progress.
- Wave Cancel Invalidation Level: 17245.9
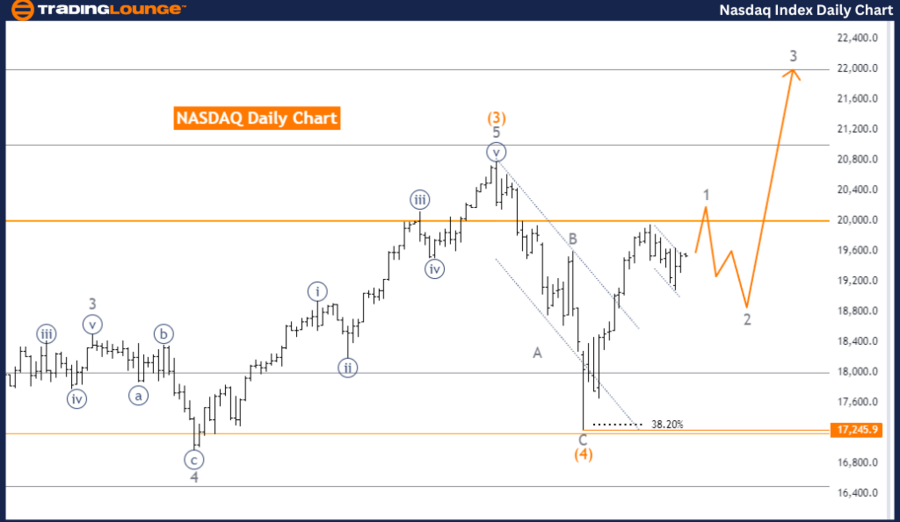
The NASDAQ weekly chart, based on Elliott Wave analysis, shows that the market is currently in an impulsive trend phase, with a focus on the progression of orange wave 5. This wave is part of a larger ongoing sequence and signifies the final upward movement following the completion of the previous corrective phase, identified as orange wave 4.
The analysis suggests that orange wave 4 has concluded, marking the end of the market's corrective phase. The market has now transitioned into orange wave 5, indicating the start of a new upward trend. This wave is expected to drive the market higher as it unfolds. The trend is considered strong due to its impulsive nature, typically characterized by a clear directional movement with minimal retracements.
Orange wave 5 is critical as it often represents the final phase of a larger wave cycle. The development of this wave is crucial in determining whether the current trend will continue. The market is expected to maintain its upward movement unless a significant reversal occurs.
A key aspect of the analysis is the wave cancel invalidation level, set at 17245.9. This level serves as a crucial threshold; if the market price falls below it, the current wave count would be invalidated, potentially indicating a change in the market's direction. However, as long as the price remains above this level, the upward trajectory of orange wave 5 is expected to continue.
In conclusion, the NASDAQ weekly chart reflects a strong bullish trend, with orange wave 5 currently in progress following the completion of orange wave 4. The analysis anticipates continued upward movement unless the price drops below the wave cancel invalidation level of 17245.9.
Technical Analyst: Malik Awais
Source: visit Tradinglounge.com and learn From the Experts Join TradingLounge Here
Previous: Bovespa Index Elliott Wave Technical Analysis
Special Trial Offer - 0.76 Cents a Day for 3 Months! Click here
Access 7 Analysts Over 200 Markets Covered. Chat Room With Support