Bovespa Index Elliott Wave Analysis Trading Lounge Day Chart
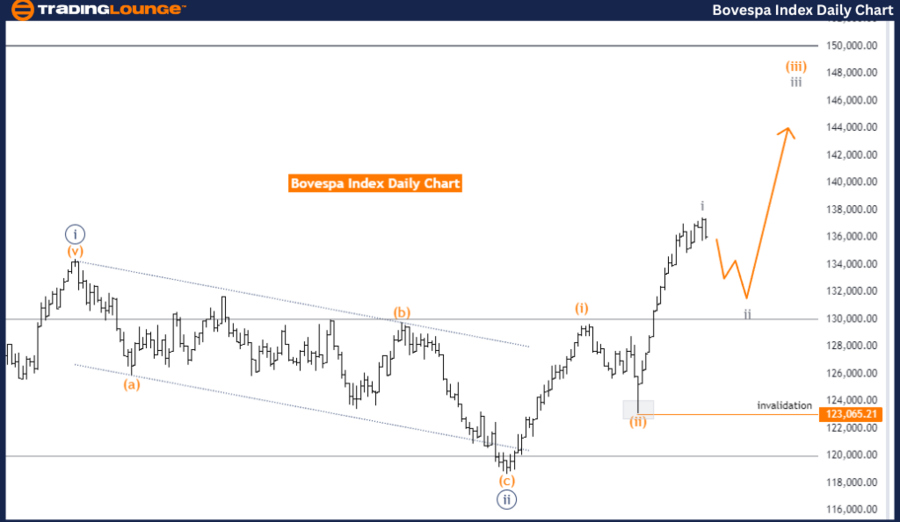
Bovespa Index Daily Chart Analysis
Bovespa Index Elliott Wave Technical Analysis
Function: Counter-Trend
Mode: Corrective
Structure: Gray Wave 2
Position: Orange Wave 3
Direction Next Higher Degrees: Gray Wave 3
Details: Gray Wave 1 appears completed, with Gray Wave 2 currently in progress. Wave Cancel Invalidation Level: 123065.21.
The Bovespa Index is currently in a counter-trend phase, as highlighted by the Elliott Wave analysis on the daily chart. This phase signifies a corrective mode, indicating a temporary movement against the prevailing trend. The primary structure identified is Gray Wave 2, suggesting that the market is undergoing a correction after the completion of the previous wave.
In this analysis, Gray Wave 1 has completed, with the market now transitioning into Gray Wave 2. This wave indicates a corrective movement within the larger trend, possibly signaling a pause or retracement before the next impulsive wave begins. The market is presently positioned within Orange Wave 3, part of the ongoing corrective structure.
The next anticipated move in the higher degree direction is driven by Gray Wave 3, expected to follow the completion of Gray Wave 2. This suggests that once the current corrective phase concludes, the market may enter another impulsive phase as Gray Wave 3 initiates. This wave is likely to continue the broader market trend.
Summary:
The Bovespa Index is in a counter-trend phase on the daily chart, marked by the completion of Gray Wave 1 and the transition into Gray Wave 2. The market is currently within Orange Wave 3, which is part of the corrective phase. The analysis suggests that the market is preparing for the next phase, which is Gray Wave 3. This analysis holds as long as the price stays above the wave cancel invalidation level of 123065.21.
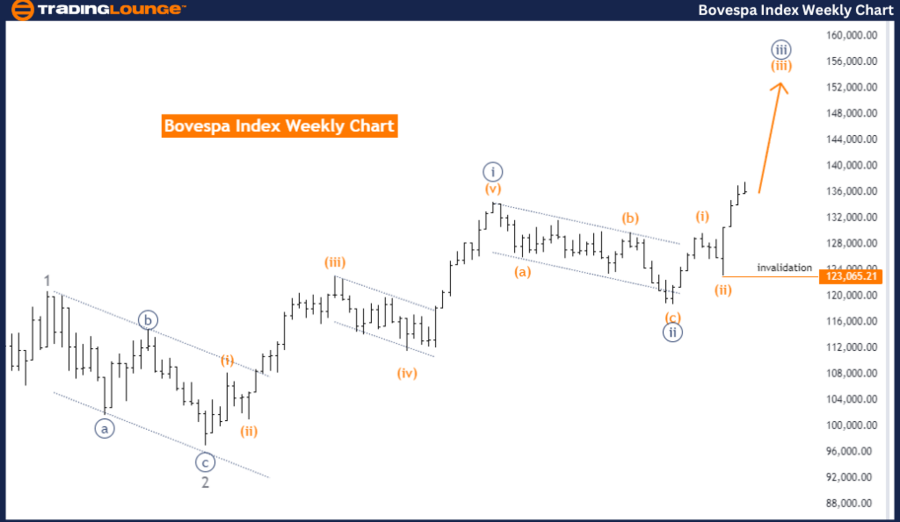
Bovespa Index Elliott Wave Analysis Trading Lounge Weekly Chart
Bovespa Index Weekly Chart Analysis
Bovespa Index Elliott Wave Technical Analysis
Function: Bullish Trend
Mode: Impulsive
Structure: Orange Wave 3
Position: Navy Blue Wave 3
Direction Next Higher Degrees: Orange Wave 3 (Continue)
Details: Orange Wave 2 appears completed, with Orange Wave 3 of 3 currently in progress. Wave Cancel Invalidation Level: 123065.21.
The Bovespa Index is currently exhibiting a bullish trend, as indicated by the Elliott Wave analysis on the weekly chart. The market is in an impulsive mode, signaling a strong upward movement in line with the overall trend. The primary structure identified is Orange Wave 3, indicating an ongoing impulsive wave within the broader bullish trend.
The analysis suggests that Orange Wave 2 has completed its formation, marking the end of the corrective phase. The market has now moved into Orange Wave 3, part of the impulsive structure expected to continue driving the market upward, thereby reinforcing the bullish trend.
The current market position is within Navy Blue Wave 3, part of the larger Orange Wave 3 structure. This position indicates that the market is in the midst of an extended upward movement as part of the ongoing impulsive phase. The direction for the next higher degrees continues to focus on the progression of Orange Wave 3, suggesting further bullish momentum in the coming periods.
Summary:
The Bovespa Index is in a strong bullish trend on the weekly chart, with the completion of Orange Wave 2 and the progression into Orange Wave 3 of 3. The current market position is within Navy Blue Wave 3, indicating an ongoing impulsive move within the broader upward trend. The analysis anticipates continued bullish momentum as Orange Wave 3 progresses. This analysis remains valid as long as the price does not exceed the wave cancel invalidation level of 123065.21.
Technical Analyst: Malik Awais
Source: visit Tradinglounge.com and learn From the Experts Join TradingLounge Here
Previous: Euro Stoxx 50 index Elliott Wave Technical Analysis
Special Trial Offer - 0.76 Cents a Day for 3 Months! Click here
Access 7 Analysts Over 200 Markets Covered. Chat Room With Support