USDJPY Elliott Wave Analysis Trading Lounge Day Chart, 6 March 24
In the realm of forex trading, mastering Elliott Wave Analysis is paramount for informed decision-making. Our USDJPY Elliott Wave Analysis Trading Lounge offers in-depth insights into the U.S. Dollar/Japanese Yen (USDJPY) currency pair, aiding traders in navigating the dynamic forex market landscape.
U.S.Dollar/Japanese Yen (USDJPY) Day Chart Analysis
USDJPY Elliott Wave Technical Analysis
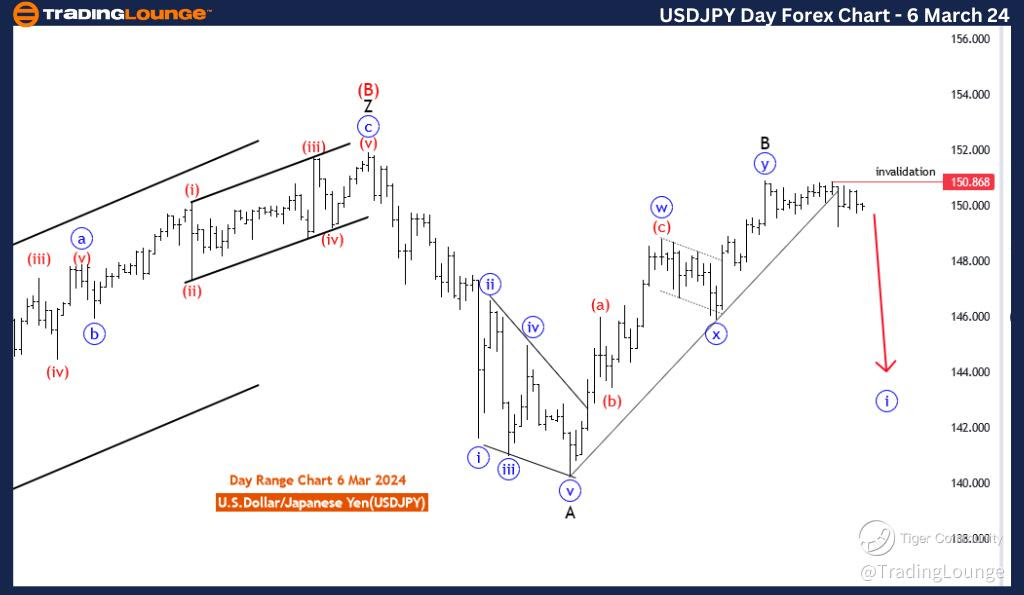
FUNCTION: Counter Trend
MODE: Impulsive
STRUCTURE: blue wave 1
POSITION: black wave C
DIRECTION NEXT LOWER DEGREES: Black wave C(continue)
DETAILS: black wave B looks completed at 150.887. Now blue wave 1 of black wave C is in play. Wave Cancel invalid level: 150.868.
The "USDJPY Elliott Wave Analysis Trading Lounge Day Chart" dated 6 March 24, offers a comprehensive analysis of the U.S. Dollar/Japanese Yen (USDJPY) currency pair using Elliott Wave principles. Examined on the day chart, the analysis provides insights into the current market conditions and potential future price movements within the broader Elliott Wave structure.
The identified "FUNCTION" is "Counter Trend," suggesting a focus on identifying and navigating movements against the prevailing trend. This implies a strategy geared towards capturing corrective movements within the larger trend.
The specified "MODE" is "Impulsive," indicating that, despite the counter-trend focus, the market is currently characterized by forceful and decisive price movements. This could suggest that the ongoing counter-trend move is exhibiting strong and persistent directional momentum.
The described "STRUCTURE" is "Blue wave 1," highlighting the specific phase within the Elliott Wave pattern. This signifies the initiation of a new impulsive wave within the broader structure, suggesting a potentially significant counter-trend move.
The identified "POSITION" is "Black wave C," indicating the current placement within the larger Elliott Wave pattern. Black wave C represents a phase within the corrective structure, and the analysis notes that "blue wave 1 of black wave C is in play."
Regarding "DIRECTION NEXT LOWER DEGREES," the focus is on "Black wave C (continue)," suggesting the expectation of further sub-waves within the ongoing corrective wave.
In the "DETAILS" section, it is mentioned that "black wave B looking completed at 150.887." This signifies the completion of a specific subwave within the corrective structure, and the analysis anticipates the initiation of "blue wave 1 of black wave C."
The "Wave Cancel invalid level" is set at 150.868, serving as a critical reference point. A breach beyond this level would invalidate the current wave count, prompting a reassessment of the analysis.
In summary, the USDJPY Elliott Wave Analysis for the day chart on 6 March 24, emphasizes a counter-trend strategy within an impulsive market environment. The focus is on the initiation of a new impulsive wave (blue wave 1) within the larger corrective structure (black wave C), with the Wave Cancel invalid level at 150.868 serving as a crucial marker for potential shifts in the wave count and trend dynamics.
USDJPY Elliott Wave Analysis Trading Lounge 4 Hour Chart, 6 March 24
U.S.Dollar/Japanese Yen (USDJPY) 4-Hour Chart Analysis
USDJPY Elliott Wave Technical Analysis
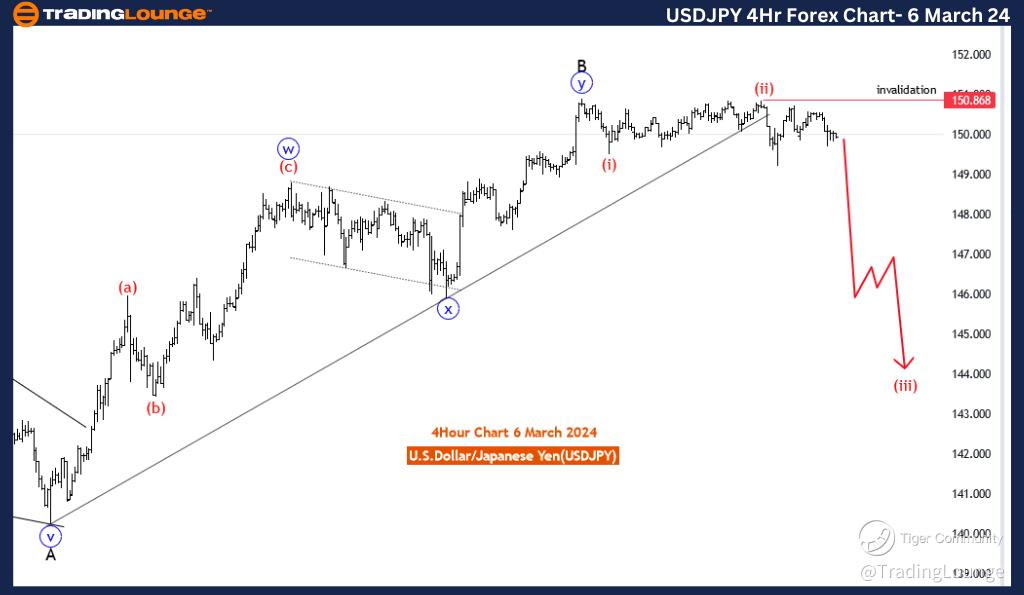
FUNCTION: Trend
MODE: Impulsive
STRUCTURE: Red wave 3
POSITION: Blue Wave 1
DIRECTION NEXT LOWER DEGREES: Red wave 3 of 1(started)
DETAILS: Red wave 2 of 1 looking completed at 150.898. Now Red wave 3 of blue wave 1 is in play. Wave Cancel invalid level: 150.868
The "USDJPY Elliott Wave Analysis Trading Lounge 4 Hour Chart" dated 6 March 24, provides a detailed analysis of the U.S. Dollar/Japanese Yen (USDJPY) currency pair using Elliott Wave principles. Examined on the 4-hour chart, this analysis aims to decipher the current market conditions and potential future price movements within the larger Elliott Wave structure.
The identified "FUNCTION" is "Trend," indicating a primary focus on identifying and navigating the prevailing trend in the USDJPY pair. This suggests an inclination towards capturing sustained directional movements over a specific time frame.
The specified "MODE" is "Impulsive," signaling that the market is currently characterized by forceful and decisive price movements that align with the overall trend. This suggests a strong and sustained directional momentum in the USDJPY pair, typical of impulsive waves.
The described "STRUCTURE" is "Red wave 3," highlighting the specific phase within the Elliott Wave pattern. This signifies a significant upward movement in the broader wave structure, indicating a strong and persistent bullish trend.
The identified "POSITION" is "Blue wave 1," indicating the current placement within the larger Elliott Wave pattern. Blue wave 1 represents the initiation of a new impulsive wave within the broader structure.
Regarding "DIRECTION NEXT LOWER DEGREES," the focus is on "Red wave 3 of 1," suggesting the anticipation of the next sub-wave within the ongoing impulsive wave. This signifies a powerful and sustained move in the upward direction.
In the "DETAILS" section, it is noted that "Red wave 2 of 1 looking completed at 150.898." This marks the conclusion of a specific sub-wave within the Elliott Wave pattern, indicating a corrective phase after an impulsive move. The analysis suggests that "Now Red wave 3 of blue wave 1 is in play," indicating the resumption of the upward impulsive wave.
The "Wave Cancel invalid level" is set at 150.868, serving as a critical reference point. A breach beyond this level would invalidate the current wave count, prompting a reassessment of the analysis.
In summary, the USDJPY Elliott Wave Analysis for the 4-hour chart on 6 March 24, emphasizes the impulsive and trending nature of the market. The analysis anticipates the continuation of the upward trend, with specific attention to the completion of sub-waves and the initiation of the next higher-degree wave. The Wave Cancel invalid level at 150.868 serves as a crucial marker for potential shifts in the wave count and trend dynamics.
Technical Analyst: Malik Awais
Source: visit Tradinglounge.com and learn From the Experts Join TradingLounge Here
See Previous: Euro/U.S.Dollar (EURUSD)
TradingLounge Once Off SPECIAL DEAL: Here > 1 month Get 3 months.