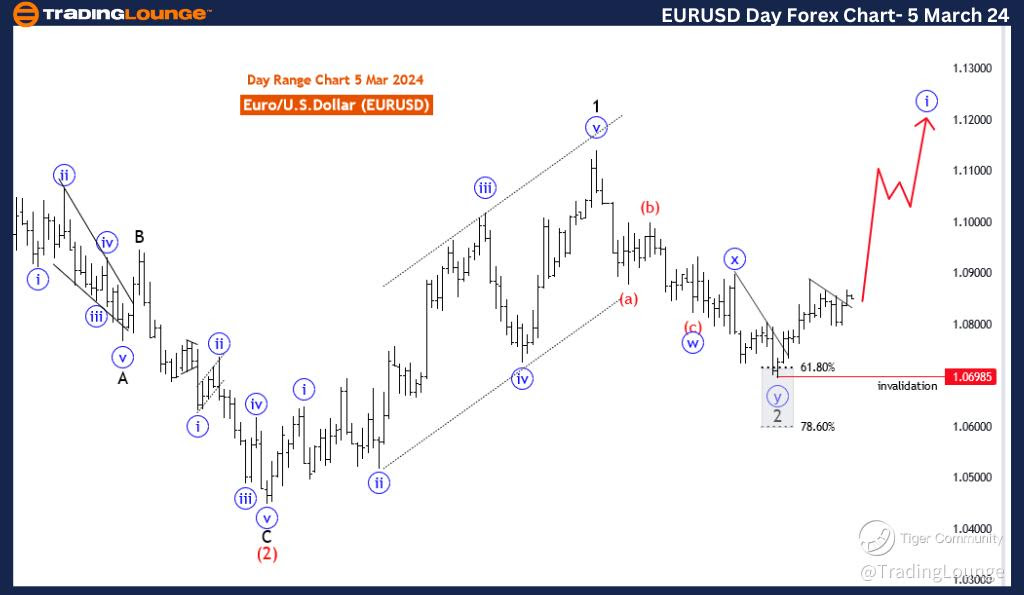
EURUSD Elliott Wave Analysis Trading Lounge Day Chart, 5 March 24
Euro/U.S.Dollar (EURUSD) Day Chart Analysis
EURUSD Elliott Wave Technical Analysis
FUNCTION: Trend
MODE: Impulsive
STRUCTURE: Blue wave 1
POSITION: black wave 3
DIRECTION NEXT LOWER DEGREES: blue wave 2
DETAILS: black wave 2 looking completed at 1.06985. Now blue wave 1 of 3 is in play. Wave Cancel invalid level: 1.06985
The "EURUSD Elliott Wave Analysis Trading Lounge Day Chart" dated 5 March 24, offers a comprehensive analysis of the Euro/U.S. Dollar (EURUSD) currency pair using the Elliott Wave methodology. Conducted on the daily chart, this analysis aims to provide insights into the prevailing trend dynamics and potential future price movements within the broader wave structure.
The identified "FUNCTION" is "Trend," indicating a primary focus on determining and navigating the existing trend in the EURUSD pair. This suggests an emphasis on identifying and capitalizing on sustained directional movements over an extended period.
The specified "MODE" is "Impulsive," suggesting that the current market conditions are characterized by forceful and decisive price movements aligned with the overall trend. This implies a strong and sustained directional momentum in the EURUSD pair, conducive to impulsive waves.
The described "STRUCTURE" is "Blue wave 1," representing a specific phase within the Elliott Wave pattern. The analysis concentrates on the development and progression of blue wave 1, indicating a significant upward movement within the broader wave structure.
The identified "POSITION" is "Black Wave 3," highlighting the current placement within the larger Elliott Wave pattern. Black wave 3 signifies a powerful phase in the upward trend of the EURUSD pair and suggests a sustained directional move.
Regarding "DIRECTION NEXT LOWER DEGREES," the focus is on "Blue Wave 2." This implies anticipation of the next corrective phase within the Elliott Wave pattern, suggesting a temporary pullback or consolidation after the completion of the impulsive black Wave 3.
In the "DETAILS" section, it is noted that "Black wave 2 looking completed at 1.06985." This signifies the conclusion of a specific sub-wave within the Elliott Wave pattern. It further states that "Now blue wave 1 of 3 is in play," indicating the initiation of the next higher-degree wave.
The "Wave Cancel invalid level" is set at 1.06985, serving as a crucial reference point. A breach beyond this level would invalidate the current wave count, necessitating a reassessment of the analysis.
In summary, the EURUSD Elliott Wave Analysis for the daily chart on 5 March 24, emphasizes the impulsive and trending nature of the market. The analysis anticipates the continuation of the upward trend, with specific attention to the completion of sub-waves and the initiation of the next higher-degree wave. The Wave Cancel invalid level at 1.06985 serves as a critical marker for potential shifts in the wave count and trend dynamics.
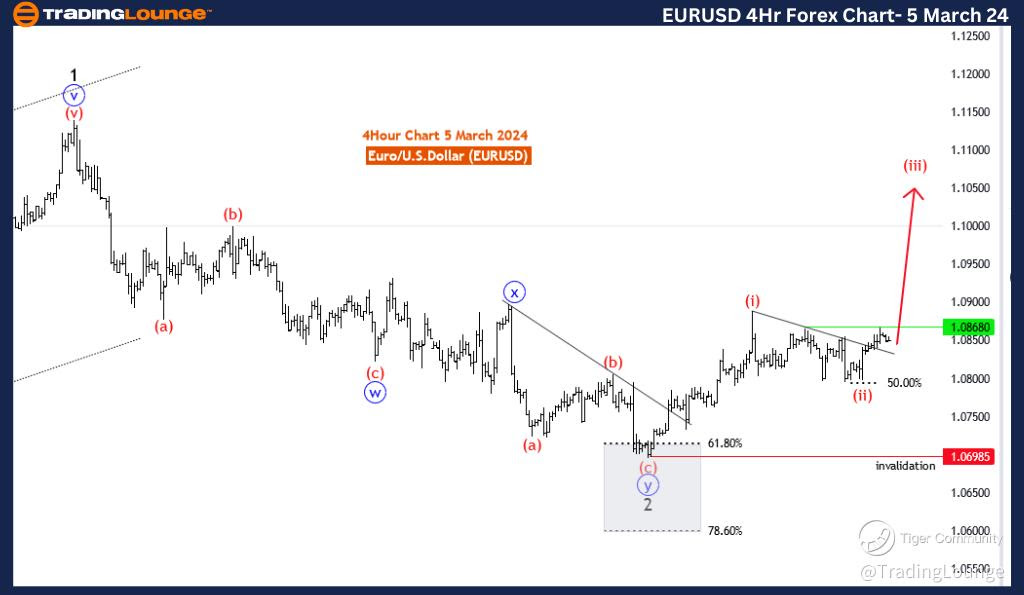
EURUSD Elliott Wave Analysis Trading Lounge 4 Hour Chart, 5 March 24
Euro/U.S.Dollar (EURUSD) 4 Hour Chart
EURUSD Elliott Wave Technical Analysis
FUNCTION: Trend
MODE: Impulsive
STRUCTURE: red wave 3
POSITION: Blue Wave 1
DIRECTION NEXT LOWER DEGREES: Red wave 4
DETAILS: Red wave 2 of 1 looking completed at 1.07958. Now Red wave 3 of blue wave 1 is in play. Wave Cancel invalid level: 1.06985
The "EURUSD Elliott Wave Analysis Trading Lounge 4 Hour Chart" dated 5 March 24, provides a detailed analysis of the Euro/U.S. Dollar (EURUSD) currency pair using the Elliott Wave methodology. The analysis is conducted on the 4-hour chart, aiming to discern the prevailing trend dynamics and forecast potential future movements within the broader wave structure.
The identified "FUNCTION" is "Trend," indicating that the analysis primarily focuses on identifying and navigating the existing trend in the EURUSD pair. The emphasis is on capturing the directional movement of prices over a more extended period.
The specified "MODE" is "Impulsive," suggesting that the current market conditions are characterized by forceful and decisive price movements aligned with the overall trend. This implies a strong and sustained directional momentum in the EURUSD pair.
The described "STRUCTURE" is "Red wave 3," representing a specific phase within the Elliott Wave pattern. The analysis focuses on the development and progression of red wave 3, indicating a significant upward movement within the broader wave structure.
The identified "POSITION" is "Blue wave 1," signifying the current placement within the larger Elliott Wave pattern. Blue wave 1 represents a higher-degree wave, suggesting a powerful phase in the upward trend of the EURUSD pair.
Regarding "DIRECTION NEXT LOWER DEGREES," the emphasis is on "Red wave 4." This highlights the anticipation of the next phase within the Elliott Wave pattern, suggesting a corrective move after the completion of the impulsive red wave 3.
The "DETAILS" section notes that "Red wave 2 of 1 looking completed at 1.07958." This signifies the completion of a specific sub wave within the Elliott Wave pattern. It further states that "Red wave 3 of blue wave 1 is in play," indicating the continuation of the upward trend and the start of the next higher-degree wave.
The "Wave Cancel invalid level" is set at 1.06985, serving as a crucial reference point. A breach beyond this level would invalidate the current wave count, necessitating a reassessment of the analysis.
In summary, the EURUSD Elliott Wave Analysis for the 4-hour chart on 5 March 24, emphasizes the impulsive and trending nature of the market. The analysis anticipates the continuation of the upward trend, with specific attention to the completion of sub-waves and the initiation of the next higher-degree wave. The Wave Cancel invalid level at 1.06985 serves as a critical marker for potential shifts in the wave count and trend dynamics.
Technical Analyst: Malik Awais
Source: visit Tradinglounge.com and learn From the Experts Join TradingLounge Here
See Previous: U.S.Dollar/Swiss Franc (USD/CHF)
TradingLounge Once Off SPECIAL DEAL: Here > 1 month Get 3 months.