14May

S&P BSE SENSEX NEXT 50 Elliott Wave Technical Analysis Reveals Bullish Wave 3 Trend in Indian Stock Market Chart Forecast

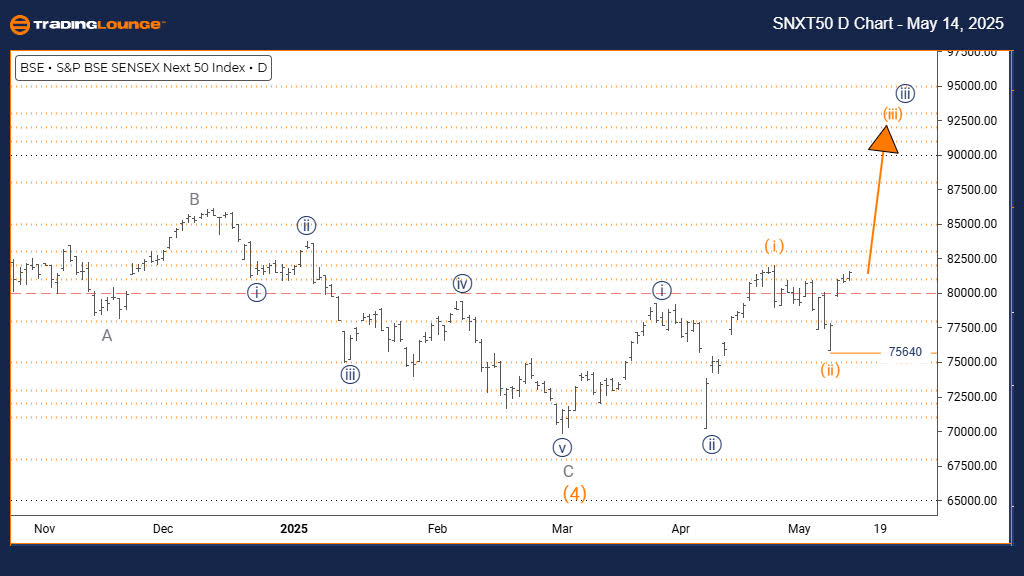
S&P BSE SENSEX NEXT 50 Elliott Wave Analysis – Trading Lounge Day Chart

S&P BSE SENSEX NEXT 50 Wave Technical Analysis

FUNCTION: Bullish Trend

MODE: Impulsive

STRUCTURE: Orange Wave 3

POSITION: Navy Blue Wave 3

DIRECTION NEXT HIGHER DEGREES: Orange Wave 3 (initiated)

DETAILS: Orange wave 2 appears finalized, with orange wave 3 actively progressing.

Wave Cancel Invalid Level: 75640

The daily chart of the S&P BSE SENSEX NEXT 50 reflects a clearly bullish trend, driven by an impulsive wave structure. Current Elliott Wave counts suggest the emergence of orange wave 3, unfolding within the upward phase of navy blue wave 3. This indicates that orange wave 2 has completed, initiating a new phase of upward momentum. Orange wave 3 typically exhibits the strongest thrust in an Elliott Wave cycle, indicating high market participation.

This wave analysis confirms the transition from orange wave 2 to 3, highlighting increased buying momentum. The invalidation level at 75640 serves as a key risk marker; any drop below this point would negate the current bullish structure and may imply a deeper market correction. The impulsive nature of the wave indicates robust market demand, likely supported by institutional investors, with ongoing potential for upside movement in navy blue wave 3.

Key Takeaways:

  • Focus remains on the advancement of orange wave 3.
  • Monitor closely for price action near the 75640 invalidation level.
  • Structure suggests early phases of a strong rally with more upside likely.

NEXT-50-Index-d-Char...


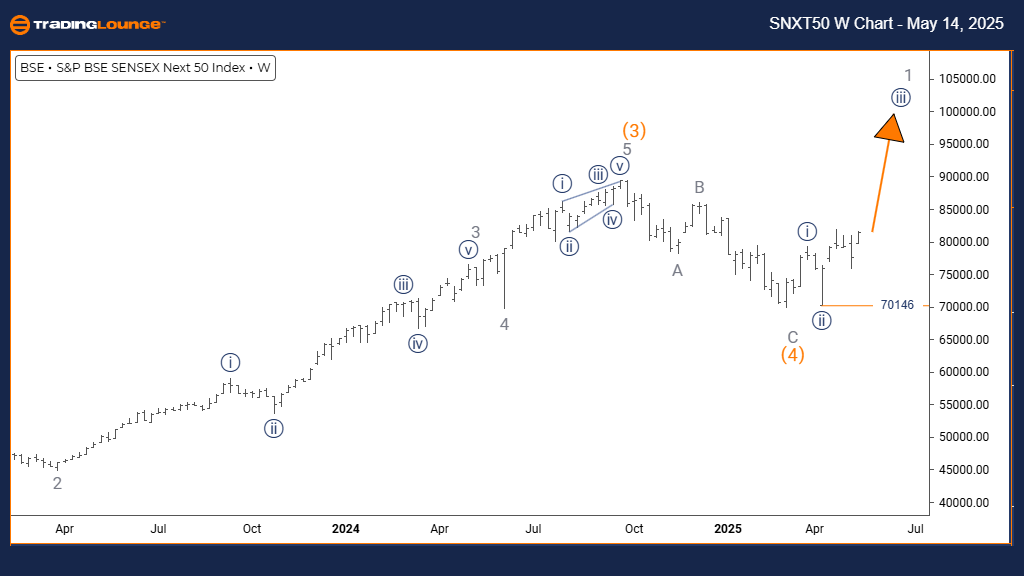
S&P BSE SENSEX NEXT 50 Elliott Wave Analysis – Trading Lounge Weekly Chart

S&P BSE SENSEX NEXT 50 Wave Technical Analysis

FUNCTION: Bullish Trend

MODE: Impulsive

STRUCTURE: Navy Blue Wave 3

POSITION: Gray Wave 1

DIRECTION NEXT HIGHER DEGREES: Navy Blue Wave 3 (active)

DETAILS: Navy blue wave 2 looks completed; navy blue wave 3 of gray wave 1 is now unfolding.

Wave Cancel Invalid Level: 70176

The weekly chart of the S&P BSE SENSEX NEXT 50 index reinforces a strong bullish sentiment, confirmed by a clear impulsive wave formation. The wave structure identifies the start of navy blue wave 3, forming as part of gray wave 1, following the conclusion of navy blue wave 2. This phase generally reflects strong upward price movement and signals a continuation of the broader bullish trend.

Analysis points to a completed navy blue wave 2, with wave 3 gaining traction. A critical invalidation level at 70176 is in place; any breach below this could undermine the current bullish count and indicate a potential shift in market direction. Price movement at this scale usually corresponds to longer-term institutional positioning. The structure of gray wave 1, in combination with navy blue wave 3, suggests the potential for prolonged upward progression.

Key Takeaways:

  • Gray wave 1 offers long-term bullish positioning.
  • Navy blue wave 3 is in focus for extended upward potential.
  • Watch for support near 70176 as a validation point for trend strength.

Technical Analyst: Malik Awais

Source: Visit Tradinglounge.com and learn from the Experts. Join TradingLounge Here 

Previous: NIKKEI 225 (N225) Elliott Wave Technical Analysis

VALUE Offer - Buy 1 Month & Get 3 Months!Click here

Access 7 Analysts Over 200 Markets Covered. Chat Room With Support

NEXT-50-Index-w-Char...

Related

ASX WESTPAC BANKING CORPORATION Elliott Wave Analysis: WBC Stock Forecast, Trend Insights, Technical Analysis & Market Outlook

ASX WESTPAC BANKING CORPORATION Elliott Wave Analysis: WBC Stock Forecast, Trend Insights, Technical Analysis & Market Outlook

Our ASX WBC Elliott Wave analysis highlights Westpac Banking Corporation’s stock trends and potenti...

Read More >
Coca-Cola Company (KO) Elliott Wave Technical Analysis: KO stock trends with Daily & 4Hr Charts

Coca-Cola Company (KO) Elliott Wave Technical Analysis: KO stock trends with Daily & 4Hr Charts

In the realm of Elliott Wave Analysis, The Coca-Cola Company (KO) is under scrutiny, with a focus on...

Read More >
Comprehensive VETUSD Elliott Wave Technical Analysis: Vechain Price Forecast, Trends, and Trading Strategies

Comprehensive VETUSD Elliott Wave Technical Analysis: Vechain Price Forecast, Trends, and Trading Strategies

This VETUSD Elliott Wave analysis provides a comprehensive look at Vechain’s current price trends, ...

Read More >
Elliott Wave Analysis and Trading Strategies for NASDAQ and Major Tech Stocks

Elliott Wave Analysis and Trading Strategies for NASDAQ and Major Tech Stocks

This week, our Elliott Wave analysis tracks two bullish counts for the NASDAQ 100 (NDX) and key tech...

Read More >
MicroStrategy Inc. (MSTR) Elliott Wave Forecast Shows Bullish Trend With Fibonacci Target

MicroStrategy Inc. (MSTR) Elliott Wave Forecast Shows Bullish Trend With Fibonacci Target

MicroStrategy (MSTR) is unfolding a bullish five-wave Elliott structure, nearing a major top before ...

Read More >
Gold (XAUUSD) Elliott Wave Analysis: Price Forecast, Key Levels and Technical Insights for Bullish and Bearish Trends in 2024

Gold (XAUUSD) Elliott Wave Analysis: Price Forecast, Key Levels and Technical Insights for Bullish and Bearish Trends in 2024

Gold remains in a bearish corrective phase while maintaining its long-term bullish trend. This Ellio...

Read More >

Buy 1 Month

Get 3 Months!

Special Offer:

Trade Recommendations

Unleash the power of deversified trading with our comprehensive portfolio, covering:

  • Stock Trades
  • Crypto Trades
  • Forex Trades
  • Commodity Trades
Elliott Wave Analysis

Gain a competive edge with expert insights in to:

  • Global Indices
  • US Stocks & ASX Stocks
  • Forex & Crypto
  • Commodities
Top-Notch Trading Tools

Equip yourself with the tools of success:

  • Social Chat
  • Elliott Wave Algorithm
  • Screener
  • TradingLevels
  • Trading Game
7 Elliott Wave Analysts

Stay ahead of the market with daily charts and insightful videos
-Your secret to strategic trading!

JOIN HERE


Welcome to TradingLounge (ASIC A.R.No. 321187), specialists in trades, trading education and technical analysis, covering stocks, indices, commodities, forex and cryptocurrencies.

When you join TradingLounge you have access to everything we offer, including trade tools, educational content and a social platform to chat with like-minded investors.

Read more

@Copyright 2024 by tradinglounge.com

Contact Us

Australian no: 02 4787 6020

International no: +61 (2) 47876020

Pay with:

Find us on