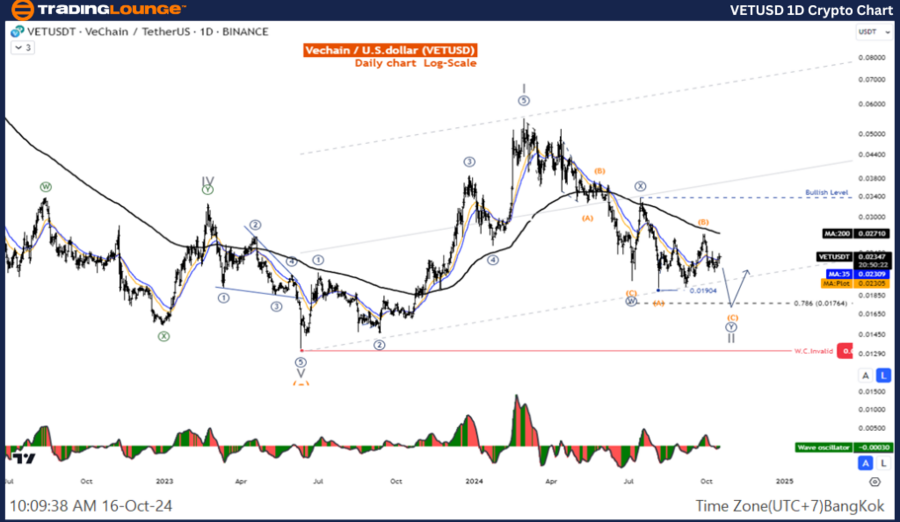
VETUSD Elliott Wave Analysis: TradingLounge Daily Chart

Vechain/ U.S. Dollar (VETUSD) Day Chart Analysis

VETUSD Elliott Wave Technical Analysis

Function: Counter trend

Mode: Corrective

Structure: Double Corrective

Position: Wave ((Y))

Next Higher Degree Direction: Wave II of Impulse

Wave Invalid Level: Price expected to remain below 0.01781

Details: Wave II may not yet be complete. The current price is likely to stay below 0.01781, signaling the continuation of the corrective pattern.

Vechain/ U.S. Dollar (VETUSD) Trading Strategy

This analysis indicates a five-wave retracement in Wave (C), where we are nearing the final phase of Wave Y. The price is expected to test the 0.017 level before seeing a potential short-term retracement. The overall outlook is bearish in the short term, but a rally is likely to follow after this retracement phase.

Vechain/ U.S. Dollar (VETUSD) Technical Indicators

  • Moving Average 200 (MA200): The price is trading below the MA200, confirming a downtrend.

  • Wave Oscillator: Showing signs of bearish momentum, reinforcing the short-term downtrend outlook.

VETUSD-1D-Crypto-Cha...


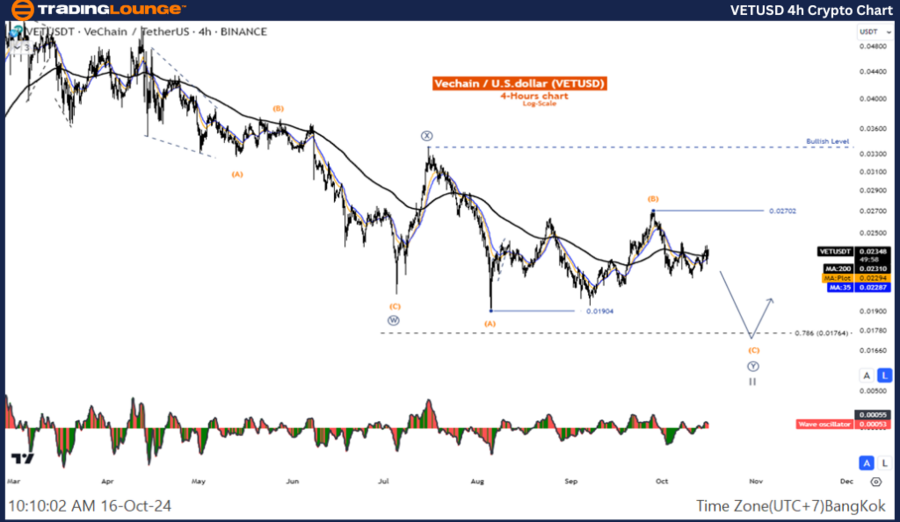
Vechain/ U.S. Dollar Elliott Wave Analysis: TradingLounge 4-Hour Chart

Vechain/ U.S. Dollar (VETUSD) 4-Hour Chart Analysis

VETUSD Crypto Technical Analysis

Function: Counter trend

Mode: Corrective

Structure: Double Corrective

Position: Wave ((Y))

Next Higher Degree Direction: Wave II of Impulse

Wave Invalid Level: Price expected to remain below 0.01781

Details: The corrective wave structure in Wave II suggests that the price may continue to stay below the 0.01781 level. The corrective pattern is not yet complete.

Vechain/ U.S. Dollar (VETUSD) Trading Strategy

A five-wave retracement is forming in Wave (C), and we are in the final stages of Wave Y. The price is likely to test the 0.017 level, which could indicate the end of this short-term retracement, with another rally potentially following.

Vechain/ U.S. Dollar (VETUSD) Technical Indicators

  • Moving Average 200 (MA200): The price is currently below the MA200, signaling a downtrend.

  • Wave Oscillator: The oscillator shows bearish momentum, supporting the expectation of continued downward movement.

Technical Analyst:  Kittiampon Somboonsod

Source: visit Tradinglounge.com and learn From the Experts Join TradingLounge Here See

Previous: BTCUSD Elliott Wave Technical Analysis

VALUE Offer - Buy 1 Month & Get 3 Months!Click here

Access 7 Analysts Over 200 Markets Covered. Chat Room With Support

VETUSD-4h-Crypto-Cha...

Related

ChainLink / U.S. dollar(LINKUSD) Elliott Wave Technical Analysis 14 December 23

ChainLink / U.S. dollar(LINKUSD) Elliott Wave Technical Analysis 14 December 23

ChainLink / U.S. dollar(LINKUSD) Elliott Wave Technical Analysis 14 December 23 remains in an uptren...

Read More >
McDonald's Corporation (MCD) Elliott Wave Analysis: A Comprehensive Daily and 4-Hour Chart Review

McDonald's Corporation (MCD) Elliott Wave Analysis: A Comprehensive Daily and 4-Hour Chart Review

This comprehensive guide dives into the intricacies of McDonald's (MCD) stock through detailed E...

Read More >
Insightful Day and 4-Hour Chart Review: British Pound/Japanese Yen(GBPJPY) Forex Elliott Wave Technical Analysis

Insightful Day and 4-Hour Chart Review: British Pound/Japanese Yen(GBPJPY) Forex Elliott Wave Technical Analysis

This comprehensive guide offers detailed GBPJPY trading analysis, focusing on Elliott Wave forecasts...

Read More >
META's Stock Movements: Meta Platforms Inc. (META) Stocks Elliott Wave Technical Analysis

META's Stock Movements: Meta Platforms Inc. (META) Stocks Elliott Wave Technical Analysis

This article provides a detailed Elliott Wave analysis of Meta Platforms Inc. (META). It covers META...

Read More >
Vanguard ASX Index Elliott Wave analysis and technical insights for ASX: V300AEQ ETF UNITS Our Report Covers Market Trends

Vanguard ASX Index Elliott Wave analysis and technical insights for ASX: V300AEQ ETF UNITS Our Report Covers Market Trends

Get comprehensive Elliott Wave analysis and technical insights for ASX: V300AEQ ETF UNITS – VAS. Ou...

Read More >
NASDAQ STOCKS, AAPL, AMZN, NVDA, META, NFLX, GOOGL, MSFT, TSLA. Elliott Wave Analysis

NASDAQ STOCKS, AAPL, AMZN, NVDA, META, NFLX, GOOGL, MSFT, TSLA. Elliott Wave Analysis

Our latest Elliott Wave analysis for NASDAQ and SP500 stocks indicates that many tech stocks are con...

Read More >

Buy 1 Month

Get 3 Months!

Special Offer:

Trade Recommendations

Unleash the power of deversified trading with our comprehensive portfolio, covering:

  • Stock Trades
  • Crypto Trades
  • Forex Trades
  • Commodity Trades
Elliott Wave Analysis

Gain a competive edge with expert insights in to:

  • Global Indices
  • US Stocks & ASX Stocks
  • Forex & Crypto
  • Commodities
Top-Notch Trading Tools

Equip yourself with the tools of success:

  • Social Chat
  • Elliott Wave Algorithm
  • Screener
  • TradingLevels
  • Trading Game
7 Elliott Wave Analysts

Stay ahead of the market with daily charts and insightful videos
-Your secret to strategic trading!

JOIN HERE


Welcome to TradingLounge (ASIC A.R.No. 321187), specialists in trades, trading education and technical analysis, covering stocks, indices, commodities, forex and cryptocurrencies.

When you join TradingLounge you have access to everything we offer, including trade tools, educational content and a social platform to chat with like-minded investors.

Read more

@Copyright 2024 by tradinglounge.com

Contact Us

Australian no: 02 4787 6020

International no: +61 (2) 47876020

Pay with:

Find us on