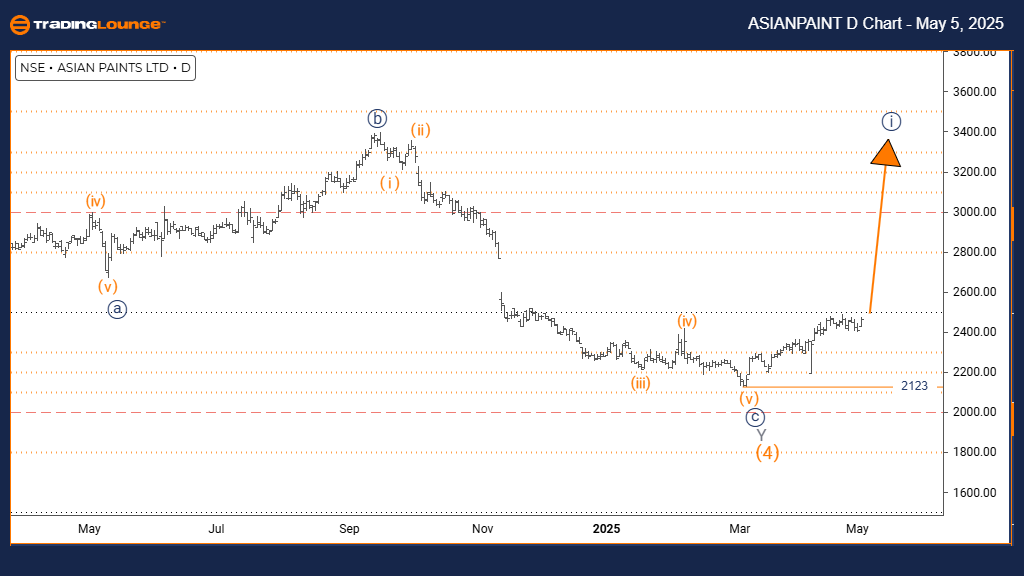
ASIAN PAINT Elliott Wave Analysis – TradingLounge Daily Chart
ASIAN PAINT Stock Daily Chart Analysis
ASIAN PAINT Elliott Wave Technical Analysis
FUNCTION: Bullish Trend
MODE: Impulsive
STRUCTURE: Navy Blue Wave 1
POSITION: Gray Wave 1
DIRECTION NEXT LOWER DEGREES: Navy Blue Wave 2
DETAILS: Orange Wave 4 correction appears complete; Navy Blue Wave 1 of 1 is now advancing.
Wave Cancel Invalid Level: 2123
Daily Chart Analysis Overview
The ASIAN PAINT daily Elliott Wave analysis shows a bullish trend unfolding within an impulsive wave structure. After completing the Orange Wave 4 correction, ASIAN PAINT has initiated Navy Blue Wave 1 within the larger Gray Wave 1 formation. This signals the beginning of a fresh bullish phase, with strong upward momentum likely in upcoming sessions.
Navy Blue Wave 1 represents the initial surge of this new impulsive sequence, typically marked by steady price increases as buyer confidence strengthens. The completion of Orange Wave 4 sets a firm foundation for this bullish movement. Early phases of Wave 1 usually display moderate gains, setting the stage for accelerated growth in later waves.
Key Levels and Market Strategy
The critical support level to monitor is 2123. A decline below this invalidation point would negate the current bullish Elliott Wave count and call for reassessment. This level safeguards the base established during Orange Wave 4 and is crucial for maintaining the bullish outlook.
Traders should observe classic Wave 1 behavior: steady gains with rising but controlled volume. Recognizing these patterns can help position for larger moves anticipated in later impulsive waves.
Next Steps and Outlook
The next major development will be the formation of Navy Blue Wave 2, a corrective phase following the completion of Wave 1. This retracement could present a strategic pullback opportunity ahead of a potential Wave 3 rally. Close monitoring of technical indicators and momentum signals will be vital for validating the wave transition.
Overall, the daily Elliott Wave forecast for ASIAN PAINT suggests a strengthening bullish structure with favorable prospects for continued upside.
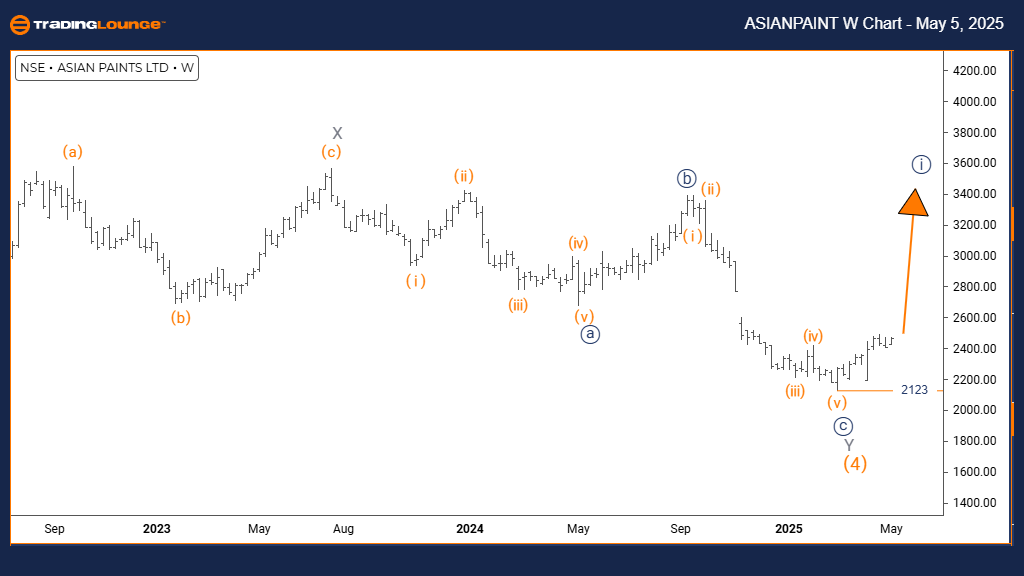
ASIAN PAINT Elliott Wave Analysis – TradingLounge Weekly Chart
ASIAN PAINT Elliott Wave Technical Analysis
FUNCTION: Bullish Trend
MODE: Impulsive
STRUCTURE: Navy Blue Wave 1
POSITION: Gray Wave 1
DIRECTION NEXT LOWER DEGREES: Navy Blue Wave 2
DETAILS: Orange Wave 4 correction appears complete; Navy Blue Wave 1 of 1 is in progress.
Wave Cancel Invalid Level: 2123
Weekly Chart Analysis Overview
The ASIAN PAINT weekly Elliott Wave analysis outlines a bullish trend emerging through an impulsive structure. Having concluded the Orange Wave 4 correction, ASIAN PAINT is now advancing through Navy Blue Wave 1 within the broader Gray Wave 1 framework. This indicates the early phase of a larger upward cycle, potentially establishing a strong bullish trend over the coming weeks.
Navy Blue Wave 1 signifies the first advance of this new impulsive sequence, often characterized by steady and consistent price appreciation. The successful completion of Orange Wave 4 creates a supportive environment for further gains, with Wave 1 typically developing gradually before giving way to stronger follow-through in later stages.
Market Structure and Key Technical Levels
The structure highlights the emergence of Gray Wave 1 at a higher degree, with Navy Blue Wave 1 acting as the foundation. This setup typically leads to broader bullish movements as technical signals and market sentiment align.
The invalidation level remains 2123. A break below this point would invalidate the bullish Elliott Wave scenario, requiring a reassessment of market positioning.
Next Moves and Trading Strategy
Following the completion of Navy Blue Wave 1, the market is expected to enter a corrective phase with Navy Blue Wave 2. This pullback could offer an attractive buying opportunity before the anticipated powerful Wave 3 upswing.
The weekly Elliott Wave forecast for ASIAN PAINT suggests that the stock is entering a favorable stage for medium-term bullish trading strategies. Monitoring technical indicators like momentum oscillators and volume profiles will be essential in confirming the continuation of the new bullish trend.
Technical Analyst: Malik Awais
Source: Visit Tradinglounge.com and learn from the Experts. Join TradingLounge Here
Previous: CIPLA Elliott Wave Technical Analysis
VALUE Offer - Buy 1 Month & Get 3 Months!Click here
Access 7 Analysts Over 200 Markets Covered. Chat Room With Support